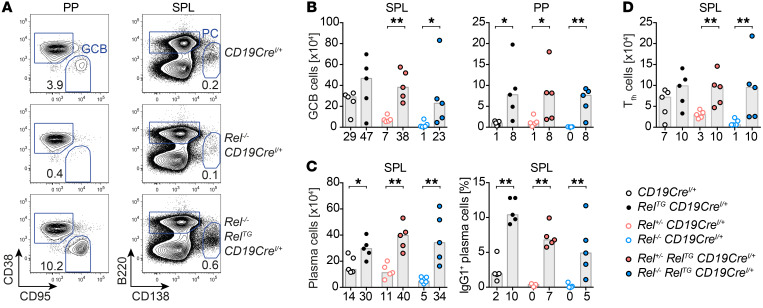
Figure 4. B cell–restricted c-Rel expression in c-Rel–knockout mice fully rescues GC reactions and class switching.
(A) Representative flow cytometry plots of GCB cells (B220+CD95hiCD38lo) and plasma cells (PC, B220loCD138+). Displayed numbers are median percentages (n = 5). (B–D) GCB cell numbers (B); plasma cell numbers and percentages of IgG1-expressing plasma cells (C); and Tfh cell (TCRβ+CD4+CD8–CXCR5hiPD-1hiICOShi) numbers (D). Individual data points obtained in 3 independent experiments are plotted. Bars and numbers below graphs are median values. *P ≤ 0.05, **P ≤ 0.01, Mann-Whitney test. SPL, spleen; PP, Peyer’s patches.

