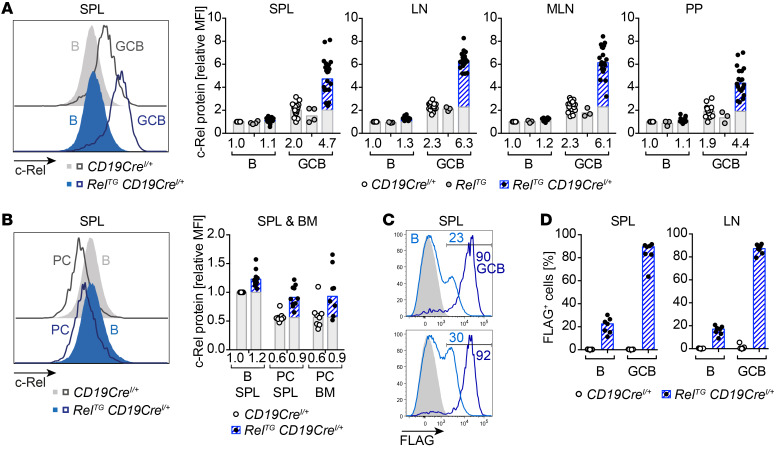
Figure 5. c-Rel protein level dynamics during terminal B cell differentiation.
(A and B) Intracellular flow cytometry data of c-Rel protein abundance. Representative flow cytometry histograms and relative median fluorescence intensities (MFIs) of intracellular c-Rel. Individual data points of 3 or more independent experiments are plotted. Bars and numbers below graphs are geometric means. The c-Rel protein fraction that is additionally present in c-Rel transgenic mice in comparison with respective control populations is highlighted in blue. (A) c-Rel levels in GCB cells (B220+/CD19+ CD95hiCD38lo) normalized to non-GCB (B, B220+/CD19+ CD38+CD95–) of CD19CreI/+ controls. (B) c-Rel expression in plasma cells (PC, B220loCD138+) normalized to B cells (B, B220+CD138–) of CD19CreI/+ controls. (C and D) Intracellular flow cytometry staining of FLAG. (C) Histograms with percentage of FLAG-positive cells of 2 representative RelTG CD19CreI/+ mice. Light blue, B cells (B220+CD38+CD95–); dark blue, GCB cells (B220+CD95hiCD38lo); gray filled, B cells of CD19CreI/+ control. Gate for FLAG-positive B cell population is displayed. (D) Percentage of FLAG-positive subpopulations in B cells and GCB cells. Individual data points (n = 7) and bars representing median values are shown. SPL, spleen; LN, lymph nodes; MLN, mesenteric lymph nodes; PP, Peyer’s patches; BM, bone marrow. See Supplemental Figure 7A.

