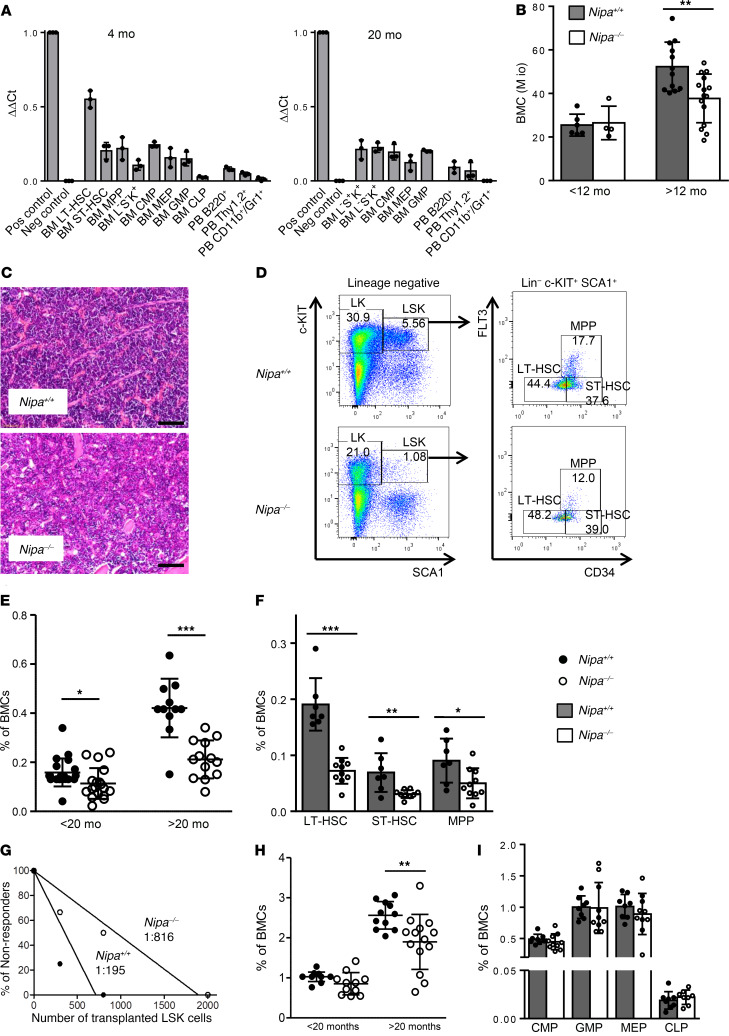
Figure 1. Deletion of Nipa leads to progressive HSC reduction and BM aplasia with age.
(A) Expression levels of Nipa in immature and mature hematopoietic cell populations from 4- and 20-month-old WT mice, as assessed by qRT-PCR. Testis germ cells served as positive control, Nipa–/– BMCs as negative control. n = 3. (B) BM cellularity of Nipa+/+ and Nipa–/– mice younger and older than 12 months. n = 19 Nipa+/+; n = 18 Nipa–/–. Mio, 1 × 10⁶. (C) Representative H&E staining of BM sections from 10-month-old mice. Original magnification, ×10. Scale bar: 100 μm. (D) Representative flow cytometry profiles of LSK cells, LT-HSCs, ST-HSCs, and MPPs in Nipa+/+ and Nipa–/– mice older than 20 months. (E) Quantification of LSK cells in Nipa+/+ and Nipa–/– BMCs from mice younger and older than 20 months. n = 32 Nipa+/+; n = 31 Nipa–/–. (F) Percentage of LSK subpopulations (LT-HSCs, ST-HSCs, and MPPs) in Nipa+/+ and Nipa–/– BMCs from mice older than 20 months. n = 7 Nipa+/+; n = 10 Nipa–/–. (G) Number of functional HSCs in vivo measured by limiting dilution Tx using different doses of LSK cells from 14- to 17-month-old mice. Nipa+/+, 1:195 (95% CI, 1:71–1:538); Nipa–/–, 1:816 (95% CI, 1:337-1:1973). (H) Quantification of LK cells in Nipa+/+ and Nipa–/– BMCs from mice younger and older than 20 months of age. n = 24 Nipa+/+; n = 26 Nipa–/–. (I) Percentage of hematopoietic progenitor populations (CMP, GMP, MEP, CLP) in Nipa+/+ and Nipa–/– BMCs of 20-month-old mice. n = 8 Nipa+/+; n = 10 Nipa–/–. *P < 0.05, **P < 0.01, ***P < 0.001. An unpaired 2-tailed Student’s t test (B, E, F, H, and I) or L-Calc software (G) was used for statistical analyses. Data are presented as mean ± SD. See also Supplemental Figure 1.

