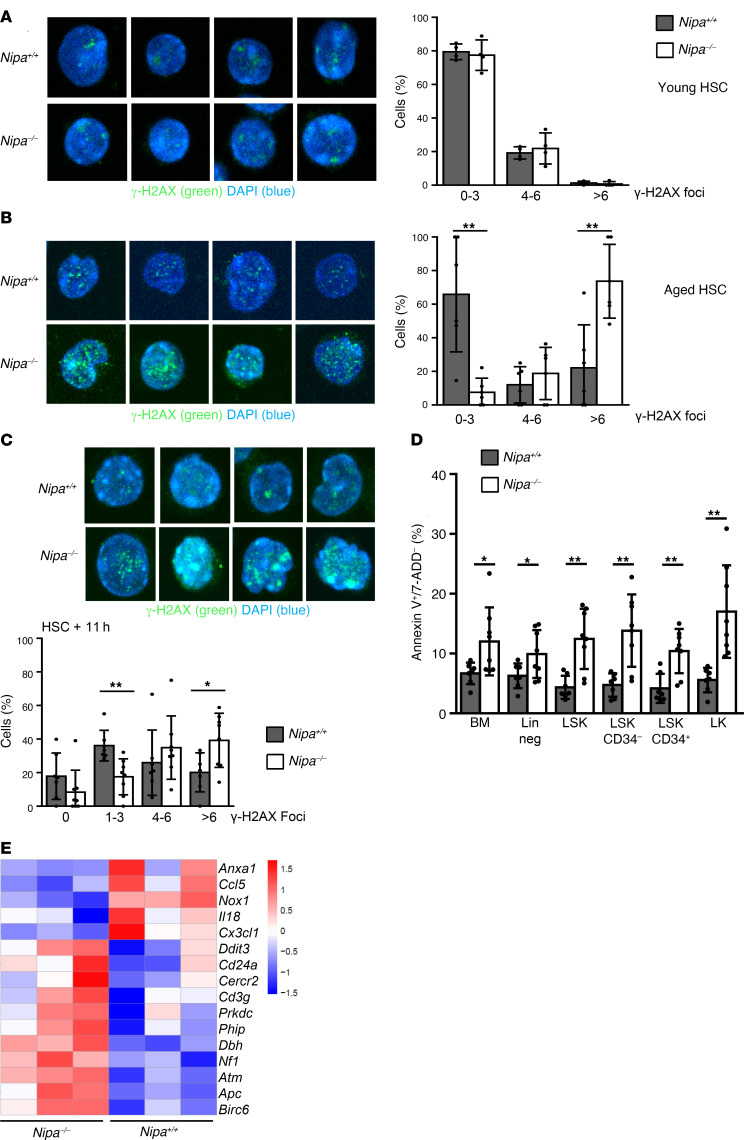
Figure 3. Nipa–/– HSCs are unable to repair DNA damage and prone to cell death.
(A) Immunofluorescence for γ-H2AX foci in young (5 months) Nipa+/+ and Nipa–/– HSCs. Representative confocal microscopy images and quantitative graph are shown. Data from 4 independent experiments. n = 53 Nipa+/+; n =62 Nipa–/–. Original magnification, ×63. (B) Immunofluorescence for γ-H2AX foci in aged (11–18 months) Nipa+/+ and Nipa–/– HSCs. Representative confocal microscopy images and quantitative graph are shown. Data are from 6 independent experiments. n = 136 Nipa+/+; n = 78 Nipa–/–. Original magnification, ×63. (C) Representative confocal microscopy images and quantitative results for 8-month-old HSCs stained for γ-H2AX 11 hours after 4-Gy irradiation. Data are from 7 independent experiments. n = 183 Nipa+/+; n = 230 Nipa–/–. Original magnification, ×63. (D) Percentages of early apoptotic cells (annexin V+7-AAD–) within hematopoietic subpopulations from Nipa+/+ and Nipa–/– mice older than 20 months. n = 8 Nipa+/+; n = 8 Nipa–/–. Lin neg, lineage-negative. (E) Heatmap of expression levels of apoptosis-related genes between aged (>20 months) untreated Nipa+/+ and Nipa–/– HSCs analyzed by microarray. Color scale represents row Z-score mRNA intensity values. *P < 0.05, **P < 0.01. An unpaired 2-tailed Student’s t test was used for statistical analyses. Data are presented as mean ± SD. See also Supplemental Figure 5.

