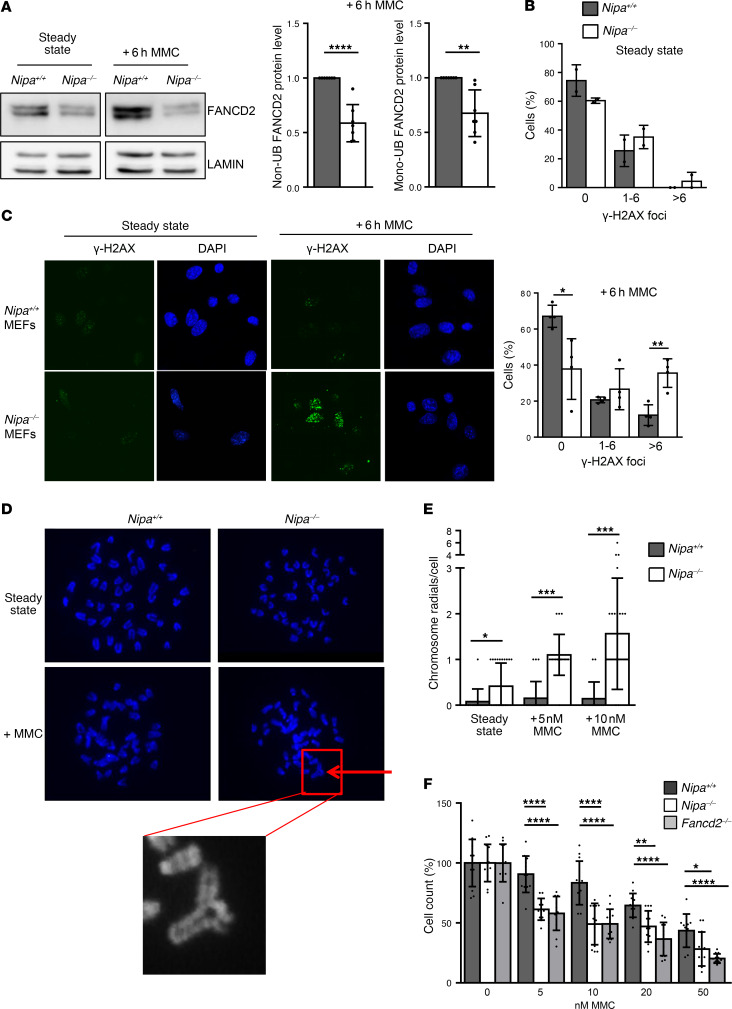
Figure 5. Nipa-deficient cells display MMC hypersensitivity as a hallmark of FA.
(A) Western blot analysis of Nipa+/+ and Nipa–/– primary MEFs (untreated and treated +6 hours with 0.5 μM MMC) for FANCD2 and lamin. Quantification of relative non- and monoubiquitinated FANCD2 protein levels of Nipa+/+ and Nipa–/– primary MEFs is shown. n = 7 Nipa+/+; n = 7 Nipa–/–. (B) Quantification of γ-H2AX foci in untreated and 0.5 μM MMC–treated Nipa+/+ and Nipa–/– primary MEFs. No MMC: data from 2 independent experiments; n = 74 Nipa+/+, n = 112 Nipa–/–. +6 hours MMC: data from 4 independent experiments; n = 121 Nipa+/+, n = 93 Nipa–/–. (C) Immunofluorescence for γ-H2AX foci in untreated and 6-hour MMC-treated (0.5 μM) Nipa+/+ and Nipa–/– primary MEFs. Representative confocal microscopy images are shown. Original magnification, ×63. (D) Representative images of DAPI-stained metaphase spreads of untreated and MMC-treated (5 nM) Nipa+/+ and Nipa–/– spleen cells after 48 hours of in vitro growth. Arrow indicates chromosome radials. Original magnification, ×100. (E) Quantification of chromosome radials per cell of untreated and MMC-treated (5 and 10 nM) Nipa+/+ and Nipa–/– spleen cells after 48 hours of in vitro growth. No MMC: n =40 Nipa+/+; n = 40 Nipa–/–. +MMC: n = 20 Nipa+/+; n = 20 Nipa–/–. (F) Cell survival assay of Nipa+/+, Nipa–/–, and Fancd2–/– MEFs measured after 5 days of culture with the indicated concentrations of MMC. Data from 2 independent experiments are shown. n = 12 Nipa+/+; n = 12 Nipa–/–; n =12 Fancd2–/–. One-way ANOVA, P = 6.4 × 10⁻⁷ (5 nM); P = 4.9 × 10⁻⁶ (10 nM); P = 1.7 × 10⁻⁵ (20 nM); P = 1.0 × 10⁻⁴ (50 nM). Reported P values in the figure from unpaired 2-tailed Student’s t test. *P < 0.05, **P < 0.01, ***P < 0.001, ****P < 0.0001. A paired (A) or unpaired (B and E) 2-tailed Student’s t test was used for statistical analyses. Data are represented as mean ± SD. See also Supplemental Figure 10.

