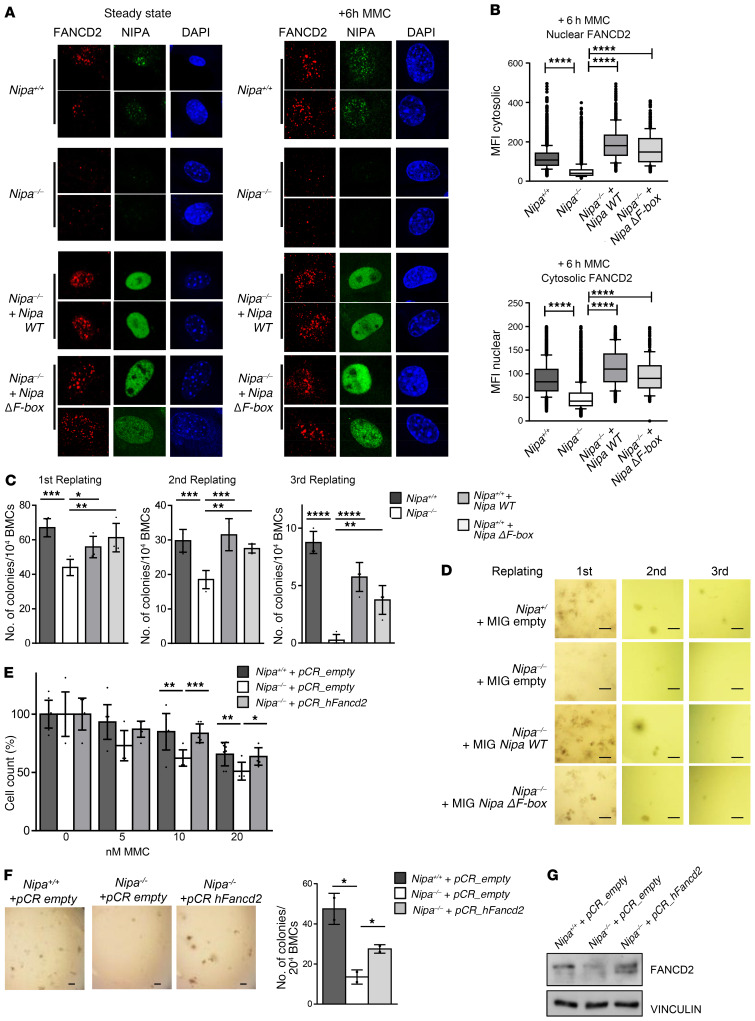
Figure 6. Fancd2 restoration can overcome the defects of Nipa-deficient cells.
(A) Immunofluorescence for FANCD2, NIPA and DAPI, in untreated and 6-hour MMC–treated (0.5 μM) Nipa+/+ and Nipa–/– primary MEFs retrovirally transfected with pBABENipaWT or pBABENipaΔF-box. Representative confocal microscopy images are shown. Original magnification, ×63. (B) Average fluorescence intensity of FANCD2 staining in the nucleus and the cytosol of the Nipa+/+ and Nipa–/– primary MEFs (+6 hour MMC) shown in A analyzed by image cytometry. Box-and-whisker plots: 10th to 90th percentile, with outliers aligned. Nuclear FANCD2: n = 4622 Nipa+/+; n = 5035 Nipa–/–; n = 722 Nipa–/– + Nipa WT; n = 315 Nipa–/– + Nipa ΔF-box. Cytosolic FANCD2: n = 3929 Nipa+/+; n = 4414 Nipa–/–; n = 593 Nipa–/– + Nipa WT; n =287 Nipa–/– + Nipa ΔF-box. Reported P values in the figure from Dunnett’s test. (C) Nipa+/+ or Nipa–/– BMCs were retrovirally infected with pMIGempty, pMIGNipaWT, or pMIGNipaΔF-box and used for in vitro CFU assay. Quantification of colonies is shown. n = 4 Nipa+/+; n = 4 Nipa–/–; n = 4 Nipa–/– + Nipa WT; n = 4 Nipa–/– + Nipa ΔF-box. Reported P values in the figure from Dunnett’s test. (D) Representative images of CFU assay described in C. Scale bars: 1000 μm. (E) Cell survival assay of Nipa+/+ and Nipa–/– primary MEFs lentivirally infected with pCRempty or pCRFancd2 measured after 5 days of culture with the indicated concentrations of MMC. Data from 2 independent tests are shown. n = 9 Nipa+/+ + pCRempty; n = 6 Nipa–/– + pCRempty; n = 6 Nipa–/– + pCRFancd2. One-way ANOVA, P = 0.004 (10 nM); P = 0.014 (20 nM). Reported P values in the figure from unpaired 2-tailed Student’s t test. (F) Nipa+/+ or Nipa–/– BMCs were lentivirally infected with pCRempty or pCRFancd2 and used for in vitro CFU assay. Representative images and quantification of colonies are shown. Scale bar: 1000 μm. n = 2 Nipa+/+ + pCRempty; n =2 Nipa–/– + pCRempty; n = 2 Nipa–/– +pCRFancd2. One-way ANOVA, P = 0.015. Reported P values in the figure from unpaired 2-tailed Student’s t test. (G) Representative Western blot of BMCs used for CFU assay shown in A. *P < 0.05, **P < 0.01, ***P < 0.001, ****P < 0.0001. Data are represented as mean ± SD. See also Supplemental Figures 11 and 12.

