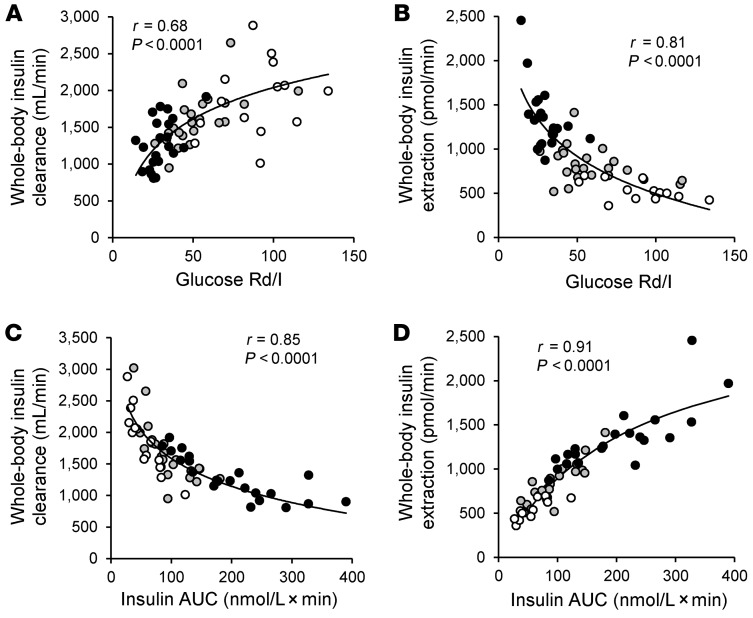
Figure 3. Relationships among insulin sensitivity and insulin concentration after glucose ingestion and whole-body insulin clearance and extraction rates.
Relationships among whole-body insulin clearance and extraction rates assessed for 3 hours after ingestion of a 75-g glucose drink and muscle insulin sensitivity, calculated as the glucose Rd (in nmol/kg FFM/min) divided by the plasma insulin (I) concentration (in pmol/L) during a HECP (A and B), and the plasma insulin concentration AUC (C and D). White, gray, and black circles represent participants in the lean-NL (n = 14), obese-NL (n = 24 in A and C and n = 23 in B and D), and obese-NAFLD (n = 22 in A and C and n = 21 in B and D) groups, respectively. Logarithmic regression analysis was used to determine the lines of best fit to the data in A–C, with Michaelis-Menten kinetics used to describe the line of best fit in D.

