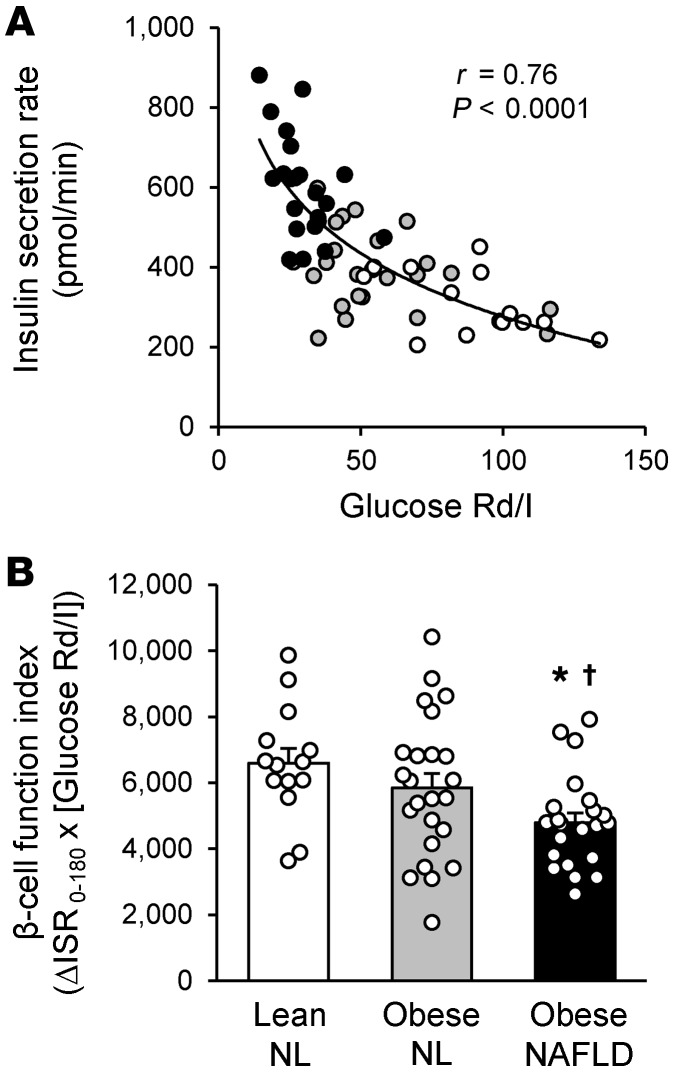
Figure 4. Indices of β cell function.
(A) Relationship between muscle insulin sensitivity, calculated as the glucose Rd (in nmol/kg FFM/min) divided by the plasma insulin (I) concentration (in pmol/L) during a HECP, and the mean insulin secretion rate, assessed for 3 hours after ingestion of a 75-g glucose drink in lean-NL (white circles; n = 14), obese-NL (gray circles; n = 24), and obese-NAFLD (black circles; n = 22) participants. Logarithmic regression analysis was used to determine the line of best fit to the data. (B) β Cell function index, calculated as the product of the incremental insulin secretion rate (in nmol × min) for 3 hours after glucose ingestion (ΔISR0–180) and muscle insulin sensitivity. Values represent the mean ± SEM. A 1-way ANCOVA with race and sex as covariates and post hoc testing where appropriate were used to identify significant mean differences between groups. *P <0.05, value significantly different from the lean-NL value; †P <0.05, value significantly different from the obese-NL value.

