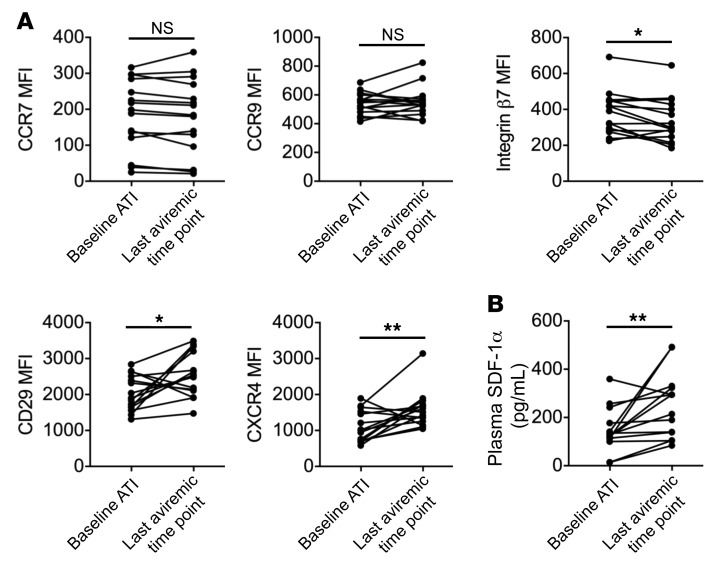
Figure 3. Expression of migration markers increases on pDCs before detectable viremia.
(A) Changes in CCR7, CCR9, integrin β7, CXCR4, and CD29 MFI between baseline ATI and the last aviremic time point are shown. (B) SDF-1α levels were measured in the plasma of RV397 participants, and changes between baseline ATI and the last aviremic time point are shown. *P < 0.05 and **P < 0.01, by Wilcoxon test. n = 15 participants from RV397 (10 of whom received VRC01).

