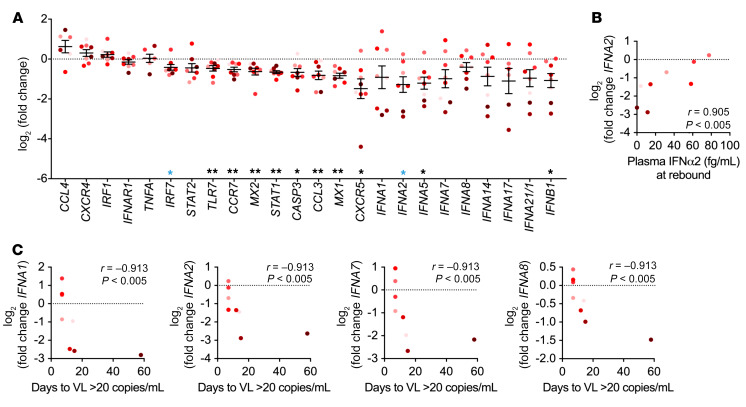
Figure 7. Type I IFN gene expression negatively correlates with time to rebound.
(A) mRNA levels of cytokines, chemokines, surface receptors, and IFN signaling molecules were measured by BioMark in sorted pDCs obtained from the pre-ATI and ATI visits. Shown is the difference in CT values between the ATI and pre-ATI time points after normalization to GAPDH. Data indicate the mean ± SEM. *P < 0.05 and **P < 0.01, by 1-sample Wilcoxon test. Blue single asterisks indicate values that were no longer significant when corrected for a FDR of 10% by the Benjamini-Hochberg procedure. (B) Spearman’s correlation between plasma IFNα2 levels after viral rebound and the change in IFNA2 levels at the ATI time point. (C) Spearman’s correlation between the change in expression of IFN genes at the ATI time point and the days from the ATI time point to viral detection. n = 8 participants from RV397 (4 of whom received VRC01).

