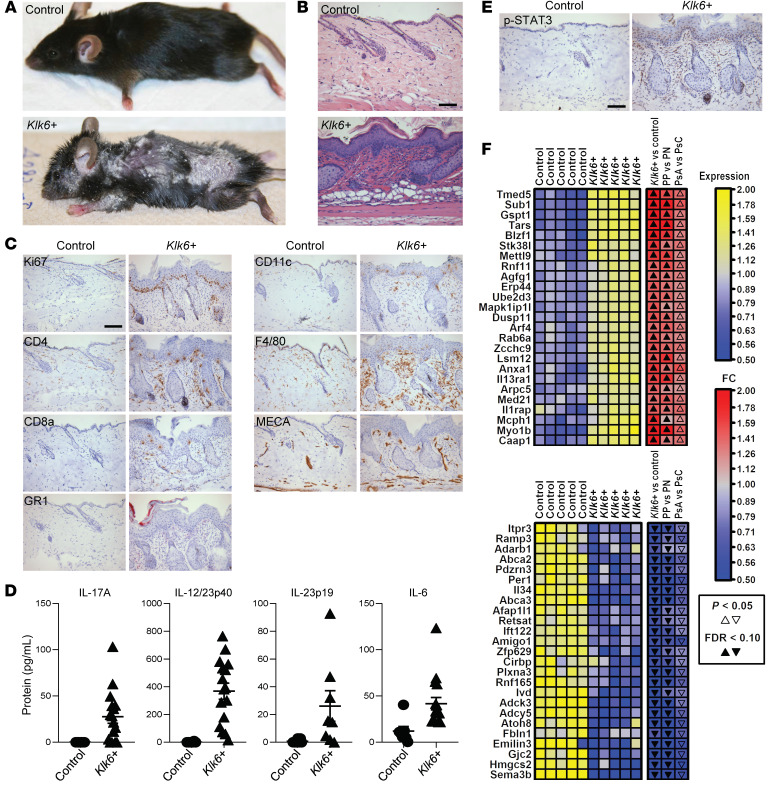
Figure 2. Epidermal Klk6 overexpression causes a severe, generalized skin rash with histologic, transcriptional, and immunological features of psoriasis.
(A) Gross images of age- and sex-matched control and Klk6+ transgenic mice. (B) H&E staining of control (N = 19) and Klk6+ (N = 38) dorsal skin. (C) Immunostaining in control and Klk6+ dorsal skin. Ki67, cell proliferation; CD4 and CD8a, T lymphocyte; GR1, granulocyte (including neutrophil); CD11c, dendritic cell; F4/80, macrophage; MECA, vascular endothelial cell. (D) Detection of IL-17A, the IL-12/23p40 subunit, the IL-23p19 subunit, and IL-6 by ELISA in control and Klk6+ skin. N ≥ 7 for all groups. P = 0.0027, P < 0.0001, P = 0.0056, and P = 0.0015, respectively, by Mann-Whitney test. Mean and SEM are indicated. (E) Phospho-STAT3 (p-STAT3) immunostaining of control and Klk6+ dorsal skin. (F) Blue-yellow heatmap showing relative expression of transcripts enriched (top panel) and depleted (bottom panel) in Klk6+ (N = 5) vs. control (N = 5) dorsal skin. Adjacent blue-red heatmaps show fold change (FC) estimates from the following 3 comparisons: Klk6+ vs. control mice, psoriatic lesional (PP) vs. nonlesional (PN) skin, and lesional skin from psoriatic arthritis patients (PsA) vs. cutaneous-only psoriatic patients (PsC). Significance by P value or false discovery rate (FDR) is indicated by solid or open arrowheads, respectively. Panels depict the 25 transcripts with the highest minimum (top) or lowest maximum (bottom) FC estimates across the 3 comparisons. For additional details, see Supplemental Methods. Scale bars: 100 μm (B, C, and E).

