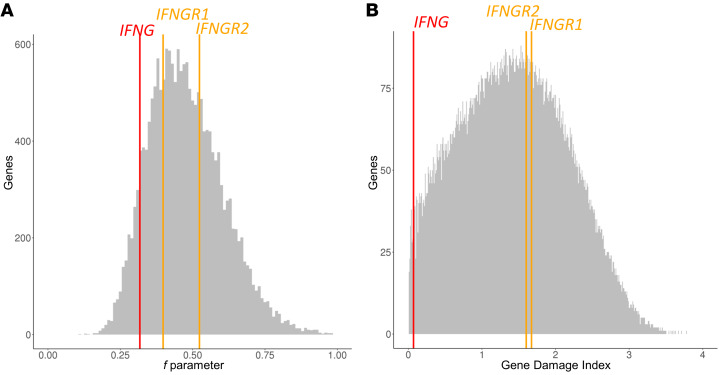
Figure 2. List of variants and strength of the purifying selection acting on IFNG.
Genome-wide distribution of the strength of purifying selection acting on genes, estimated by (A) the f parameter, for which lower values in the interval [0,1] correspond to stronger purifying selection, and (B) GDI rank, for which higher values correspond to highly tolerant genes, on bar plots for the IFNG, IFNGR1, and IFNGR2 genes. The positions of IFNG, IFNGR1, and IFNGR2 are indicated by 1 red arrow and 2 orange vertical bars, respectively.

