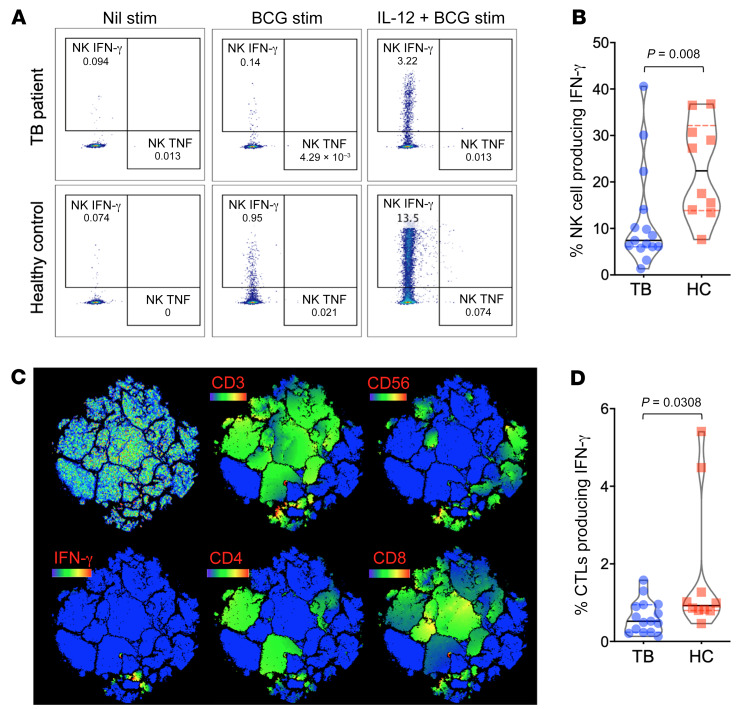
Figure 7. Decreased IL-12–inducible IFN-γ production.
PBMCs from patients with TB (n = 15) and asymptomatic healthy household contacts (n = 10) were treated overnight with PBS media control (Nil stim), or were stimulated with BCG sonicate (5 μg) or IL-12 (20 ng/mL) and BCG (minimum of 0.5 × 10⁶ PBMCs per condition) followed by multidimensional flow cytometry. See Supplemental Figure 3 for the gating strategy and representative dot plots of CD3+CD4+ and CD3+CD8+ T cells. (A) Representative dot plots of NK cell (CD3–CD56+) production of IFN-γ and TNF-α after no stimulation or stimulation with BCG or with IL-12 plus BCG. (B) t-distributed stochastic neighbor embedding (tSNE) dimension reduction clustering of PBMCs from a control and from patients with TB demonstrated the cell-specific (CD3, CD4, CD8, and CD56) contribution of IFN-γ production after combined IL-12 and BCG stimulation, with blue indicating no protein expression, and green, yellow, and red indicating increasing protein expression. (C and D) Dot plots demonstrate the percentage of CTLs (CD3+CD8+) and NK cells (CD3–CD56+) that produced IFN-γ after stimulation with IL-12 and BCG. P = 0.0308 and 0.008, by Mann-Whitney U test, for CTLs and NK cells, respectively.

