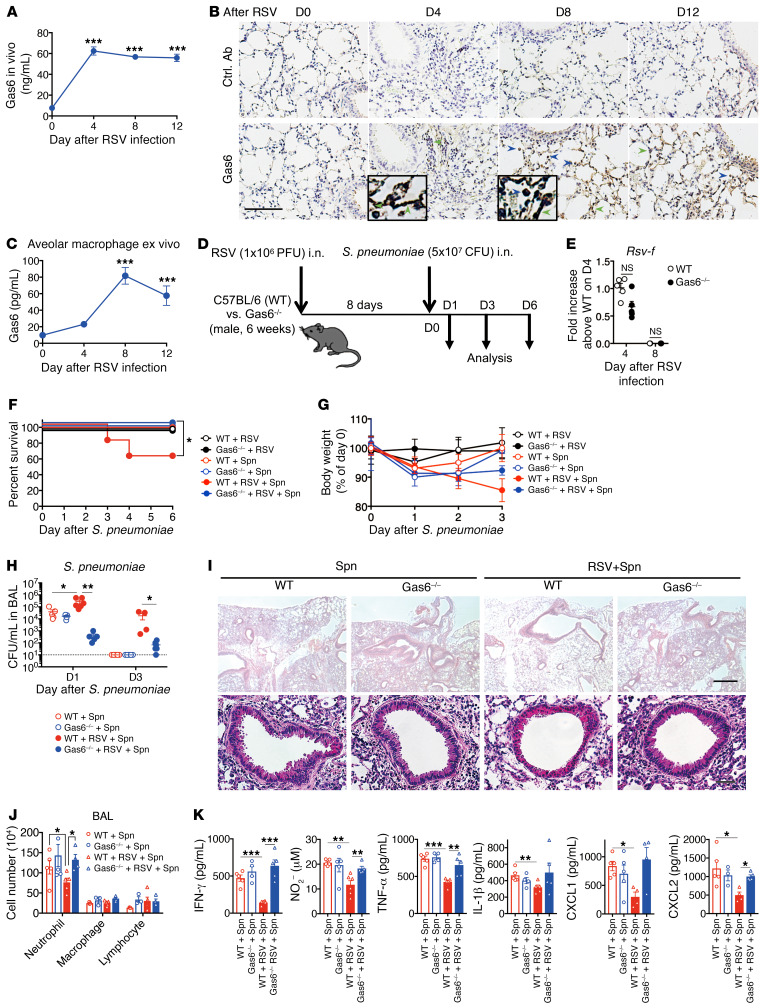
Figure 1. RSV-induced Gas6 enhances susceptibility to S. pneumoniae.
(A) Gas6 levels in the BAL fluid from an RSV-infected lung of a WT mouse. (B) Immunohistochemical analysis (DAB) of Gas6 in the tissue sections from a naive (D0) and RSV-infected lung. Blue arrows indicate Gas6+ macrophages and green arrows indicate Gas6+ epithelial cells. Scale bar: 200 μm. (C) Gas6 levels in the culture supernatant of alveolar macrophages isolated from naive and RSV-infected mice on days 4, 8, and 12 after infection. (D) WT and Gas6–/– mice were infected with S. pneumoniae at day 8 after RSV infection and euthanized on days 1, 2, 3, and 6 after S pneumoniae infection. (E) Titers of RSV in the whole lung from RSV-infected mice on days 4 and 8 after RSV infection. (F) Changes in the survival rate and (G) body weight of RSV-infected WT or Gas6–/– mice after S. pneumoniae infection. (H) Titers of S. pneumoniae in the BAL fluid from RSV-infected mice on days 1 and 3 after S. pneumoniae infection. (I) Representative H&E-stained lung tissue sections on day 1 after S. pneumoniae infection. Scale bars: 200 μm (upper), 50 μm (lower). (J) Number of neutrophils, macrophages, and lymphocytes in the BAL fluid on day 1 after S. pneumoniae infection. (K) The levels of IFN-γ, NO, TNF-α, IL-1β, CXCL1, and CXCL2 in the BAL fluid from WT and Gas6–/– mice on day 1 after S. pneumoniae infection. The data are expressed as mean ± SEM; n = 10 (F and G), n = 4–6 (except for F and G). Representative results from 2 independent experiments are shown. The following statistical tests were used: 1-way ANOVA (A, C, H, J, and K), 2-tailed Student’s t test (E), and Gehan-Breslow-Wilcoxon test (F). *P < 0.05; **P < 0.01; ***P < 0.001.

