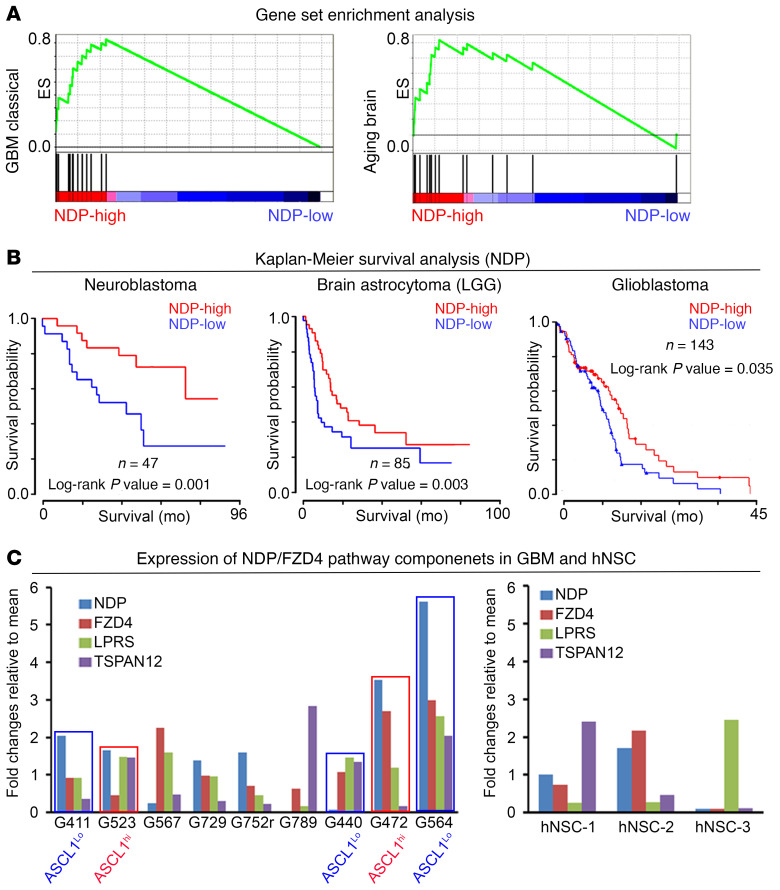
Figure 2. NDP is expressed in GSCs and correlates with survival in neurological tumors.
(A) Gene set enrichment analysis reveals correlation between NDP expression and “Glioblastoma Classical” and “Aging Brain” gene sets. (B) Kaplan-Meier analysis correlating NDP expression with patient survival in neurological cancers. (C) Expression of components of the NDP/FZD4 signaling axis in a panel of 9 patient-derived GSCs (left) and 3 primary fetal hNSC lines (right). Blue boxes, ASCL1lo GSC lines; red, ASCL1hi GSC lines indicate the GSC lines selected for functional analysis.

