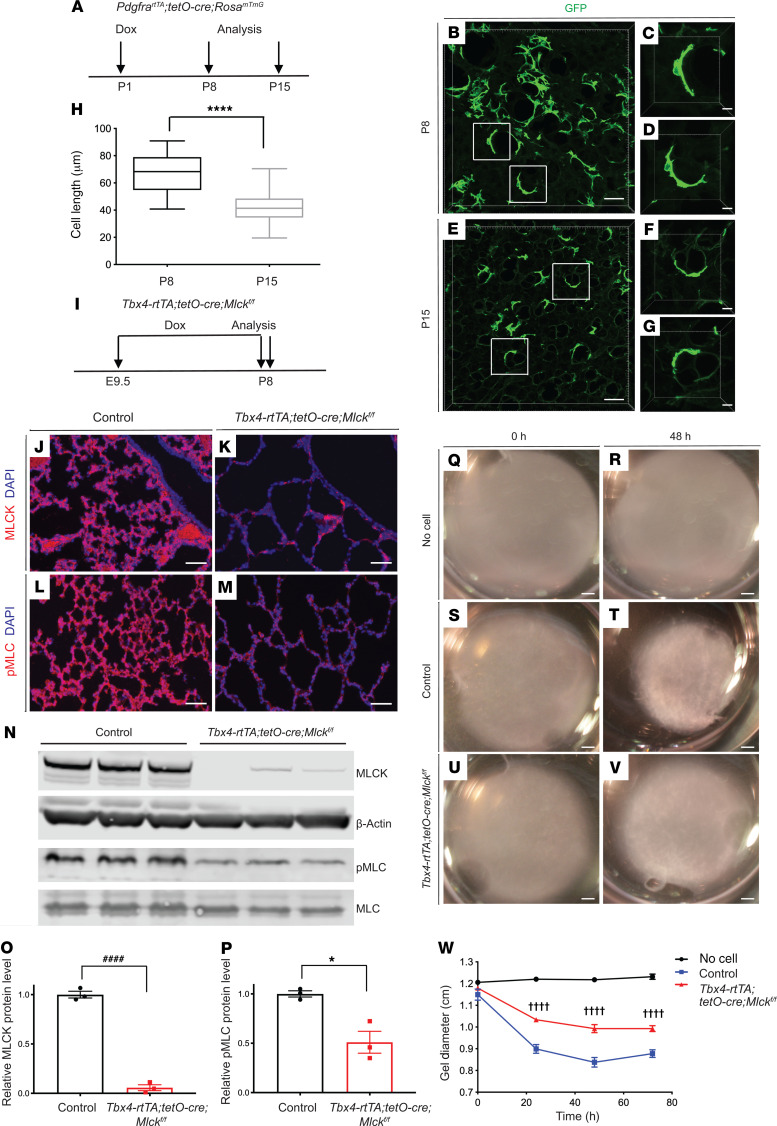
Figure 1. Mlck inactivation leads to decreased myofibroblast contraction.
(A) Timeline of dox treatment and analysis of PdgfrartTA tetO-Cre RosamTmG pups for assessment of cell morphology. (B–G) Representative images of reconstructed 70-μm z-stacks of GFP pattern (green) in the alveolar region of lungs at P8 (B–D) and P15 (E–G). (H) Quantification for images in B–G. ****P = 0.0000005 (n = 20 cells per stage selected from 3 samples at P8 and 2 samples at P15). (I) Timeline of dox-mediated gene inactivation and analysis. (J–M) Representative immunofluorescence staining for MLCK (J and K) and p-MLC (L and M) in the alveolar region of control and mutant lungs at P8. (N) Western blot analysis of lung tissues using antibodies against MLCK, β-actin, p-MLC, and MLC. (O) Western blot quantification indicated that MLCK levels were decreased in mutant compared with control lungs at P8. ####P = 0.000033 (n = 3). (P) Western blot quantification indicated a decrease in the ratio of p-MLC to MLC levels in mutant compared with control lungs at P8. *P = 0.0133 (n = 3). (Q–V) Representative collagen gel images for no cells, control PdgfraGFP-positive myofibroblasts and mutant PdgfraGFP-positive myofibroblasts at 0 hours and 48 hours. (W) Quantification for images in Q–V. ††††P < 0.0001, control versus Tbx4-rtTA tetO-Cre Mlckfl/fl at 24 hours (n = 3); ††††P < 0.0001, control versus Tbx4-rtTA tetO-Cre Mlckfl/fl at 48 hours (n = 3); ††††P < 0.0001, control versus Tbx4-rtTA tetO-Cre Mlckfl/fl at 72 hours (n = 3). Scale bars: 50 μm (B, E, and J–M), 10 μm (C, D, F, and G), and 1 mm (Q–V). Data represent the mean ± SEM. P values were determined by 2-tailed Student’s t test (H, O, and P) and 2-way ANOVA with Tukey’s method to adjust for multiple comparisons (W).

