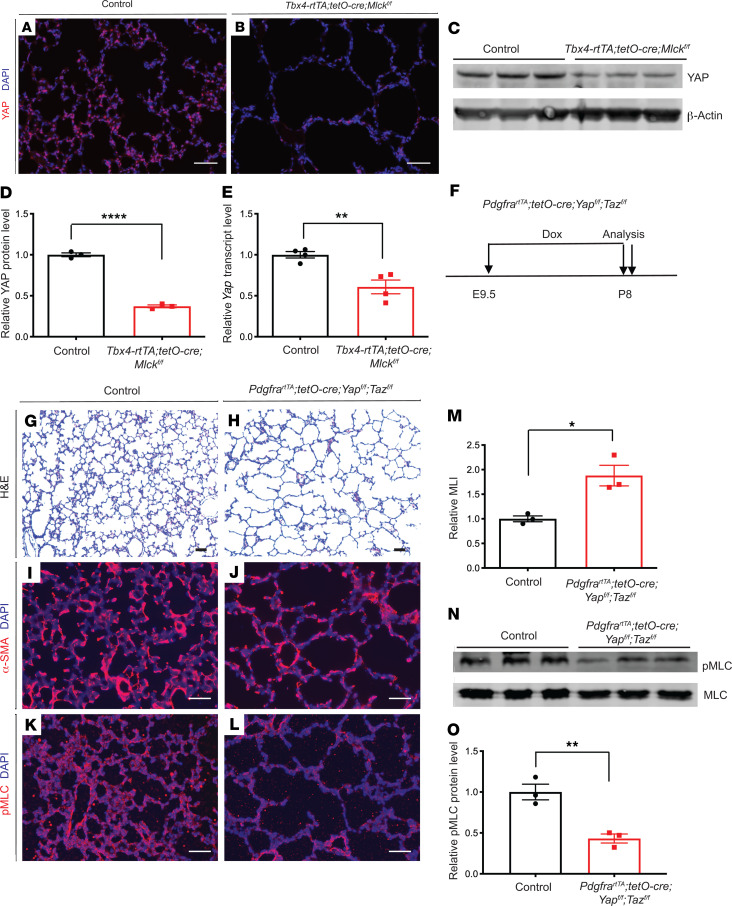
Figure 5. Mlck-mutant lungs exhibit decreased YAP, and inactivation of Yap leads to alveolar simplification, similar to the Mlck mutant.
(A and B) Representative immunofluorescence staining for total YAP (red) in the alveolar region showing mutant lungs with decreased YAP on P8. (C and D) Western blot analysis and quantification indicated that YAP levels were decreased in mutant lungs compared with controls on P8. ****P = 0.000045 (n = 3). β-Actin was used as a control. (E) qPCR showed that mutant lungs exhibited decreased Yap transcript levels on P8. **P = 0.0053 (n = 4). (F) Timeline of dox-induced inactivation and analysis. (G and H) Representative H&E-stained sections from the alveolar regions of P8 lungs showed simplified alveoli in Yap Taz–mutant lungs. (I and J) Representative immunofluorescence staining for α-SMA (red) in the alveolar region show that mutant lungs had abnormally localized myofibroblasts on P8. (K and L) Representative immunofluorescence staining for p-MLC (red) in the alveolar region show that mutant lungs had decreased MLC phosphorylation. (M) Quantification of alveolar simplification by MLI. *P = 0.0157 (n = 3). (N and O) Western blot analysis and quantification indicated that the ratio of p-MLC to MLC levels was decreased in the mutant lungs compared with control lungs on P8. **P = 0.0067 (n = 3). Data represent the mean ± SEM. P values were determined by 2-tailed Student’s t test. Scale bars: 50 μm.

