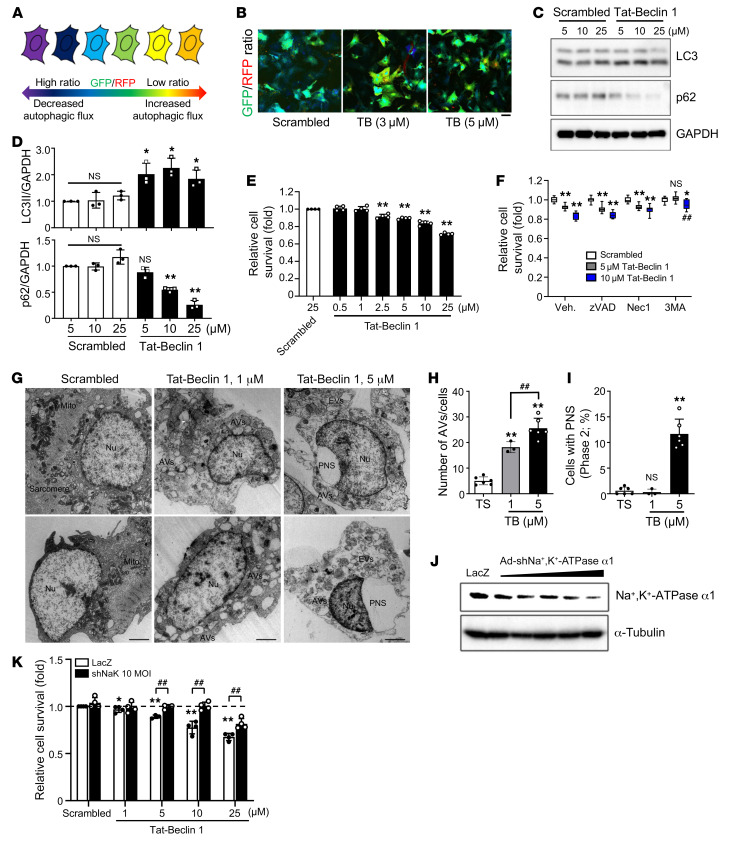
Figure 1. Tat–Beclin 1 induces autosis in CMs.
(A) The autophagic flux probe GFP-LC3-RFP. (B) NRCMs were transduced with Ad-GFP-LC3-RFP and treated with Tat–Beclin 1 (TB) for 3 hours. GFP/RFP ratio is shown. n = 5 each; scale bar: 20 μm. (C) NRCMs were treated with Tat–Beclin 1 for 2 hours and analyzed by Western blotting. See complete unedited blots in the supplemental material. (D) Ratios of LC3-II to GAPDH and p62 to GAPDH. Mean ± SD, n = 3; *P < 0.05, **P < 0.01, 1-way ANOVA with Tukey’s post hoc test. (E) NRCMs were treated with Tat–Beclin 1 for 3 hours and analyzed with CellTiter-Blue assays. Mean ± SD, n = 4 values were measured from more than 8 different wells per experiment; **P < 0.01, 1-way ANOVA with Dunnett’s post hoc test. (F) NRCMs were pretreated with Z-VAD, Nec1, or 3MA for 1 hour; treated with Tat–Beclin 1 for 3 hours; and analyzed with CellTiter-Blue assays. Mean ± SD, n = 11 (Scrambled, 5 μM Tat–Beclin 1), n = 8 (10 μM Tat-Beclin 1); *P < 0.05, **P < 0.01 vs. Scrambled, ##P < 0.01 vs. 10 μM Tat–Beclin 1 with vehicle (Veh.), 2-way ANOVA. (G–I) NRCMs were treated with Tat–Beclin 1 for 3 hours and subjected to EM analyses. (G) Nuclei (Nu), ballooning of the PNS, empty vacuoles (EVs), mitochondria (Mito), sarcomeres, and autophagic vacuoles (AVs) (scale bars: 2 μm). Number of AVs per cell (H) and percentage of cells with PNS (I) were evaluated from more than 10 different areas (H) and more than 20 CM nuclei (I) in each experiment. Mean ± SEM, n = 6 (Tat-Scrambled [TS], 5 μM Tat–Beclin 1), n = 3 (1 μM Tat–Beclin 1); **P < 0.01 vs. Tat-Scrambled; ##P < 0.01, 1-way ANOVA with Tukey’s post hoc test. (J) NRCMs were transduced with Ad–shNa+,K+-ATPase α1 and analyzed by Western blotting. (K) NRCMs were transduced with Ad-shNa+,K+-ATPase α1, then treated with Tat–Beclin 1 for 3 hours, and analyzed with CellTiter-Blue assays (mean ± SD, n = 4, values were measured from more than 16 wells per experiment; *P < 0.05, **P < 0.01 vs. Scrambled, ##P < 0.01, 2-way ANOVA). See also Supplemental Figure 1.

