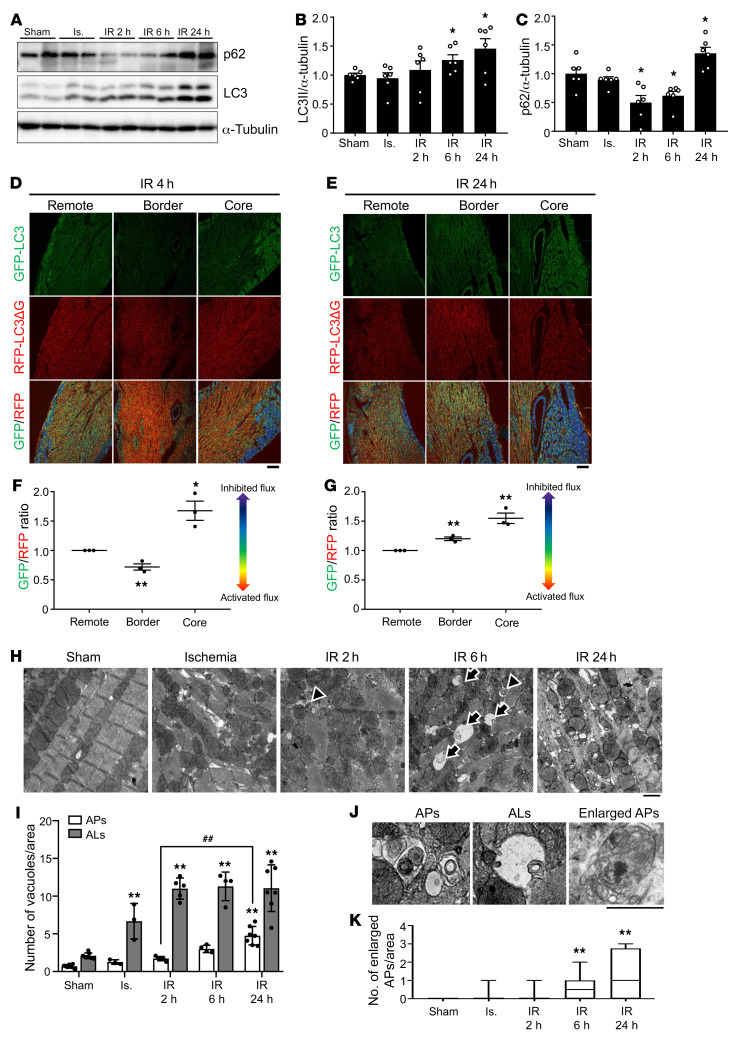
Figure 3. Autophagic flux is increased during early reperfusion but is inhibited during late reperfusion in the mouse heart.
(A–C) Three-month-old C57BL/6J mice were subjected to 30 minutes of ischemia (Is.) followed by reperfusion for the indicated times, and the border region of infarction in the heart was analyzed by Western blotting using anti-p62, anti-LC3, and anti–α-tubulin antibodies (A). The ratios of LC3-II (B) and p62 to α-tubulin (C) were quantified (mean ± SEM, n = 6; *P < 0.05 vs. Sham, 1-way ANOVA with Dunnett’s post hoc test). (D–G) Three-month-old cardiac tissue–specific GFP-LC3-RFP-LC3ΔG transgenic mice were subjected to I/R for 4 and 24 hours. and hearts were analyzed by confocal microscopy to assess autophagic flux. Representative fluorescence ratio images of heart sections from cardiac tissue–specific GFP-LC3-RFP-LC3ΔG transgenic mice subjected to I/R for 4 (D) and 24 hours (E). Scale bars: 100 μm. The graph shows quantification of GFP/RFP fluorescence ratio intensities at 4 (F) and 24 hours (G) (mean ± SEM, n = 3; *P < 0.05, **P < 0.01 vs. remote region, 1-way ANOVA with Dunnett’s post hoc test). (H–K) Samples of hearts from mice subjected to I/R for various periods of time were subjected to EM analyses. Autolysosomes (ALs, arrow) and autophagosomes (APs, arrowhead) are indicated (H) and enlarged (J). Scale bars: 1 μm. Cytoplasmic ALs and APs (I) and enlarged APs with nondegraded materials (K) were counted. (I and K) Mean ± SEM, n = 7 for sham, n = 3 for ischemia, n = 5 for IR 2 hours, n = 4 for IR 6 hours, n = 7 for IR 24 hours; **P < 0.01 versus Sham, ##P < 0.01; values were measured from more than 10 different areas per mouse; 2-way ANOVA (I) and 1-way ANOVA with Dunnett’s post hoc test (K). See also Supplemental Figure 3.

