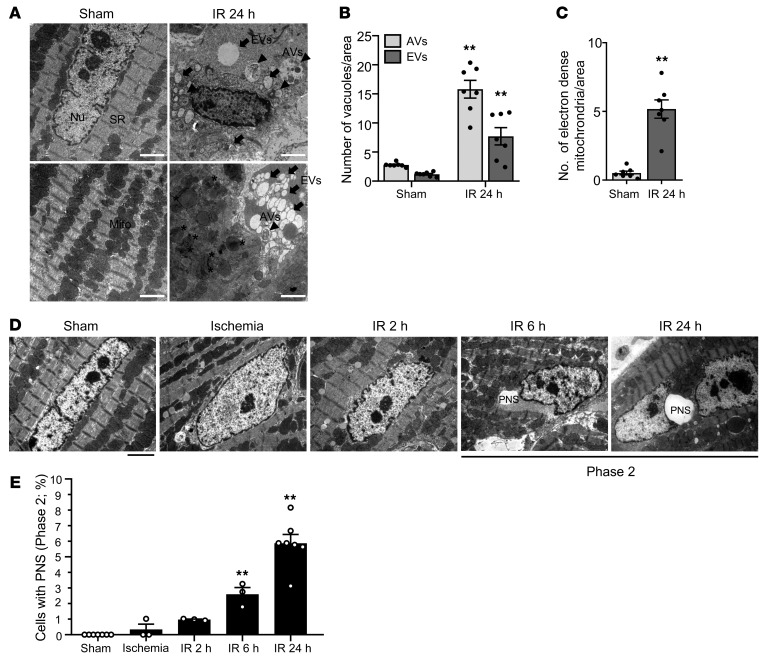
Figure 4. Autosis is induced in the heart during I/R.
(A–E) Mice were subjected to 30 minutes of ischemia with reperfusion for the indicated periods of time, and heart samples were subjected to EM analyses. (A) Autophagic vacuoles (AVs, arrowheads), empty vacuoles (EVs, arrow), and electron-dense mitochondria (asterisks) are indicated (scale bars: 2 μm). SR, sarcoplasmic reticulum. Cytoplasmic AVs and EVs (B) and electron-dense mitochondria (C) were counted. Representative images of CM nuclei showing ballooning of the PNS (scale bar: 2 μm) (D). (E) The percentage of cells with ballooning of the PNS was calculated. Mean ± SEM, n = 7 for sham and IR 24 hours; n = 3 for ischemia, IR 2 hours, and IR 6 hours. **P < 0.01 versus Sham; values were measured from more than 10 different areas (B and C) and more than 100 CM nuclei (E) per mouse; 2-way ANOVA (B), unpaired Student’s t test (C), and 1-way ANOVA with Dunnett’s post hoc test (E). See also Supplemental Figure 4.

