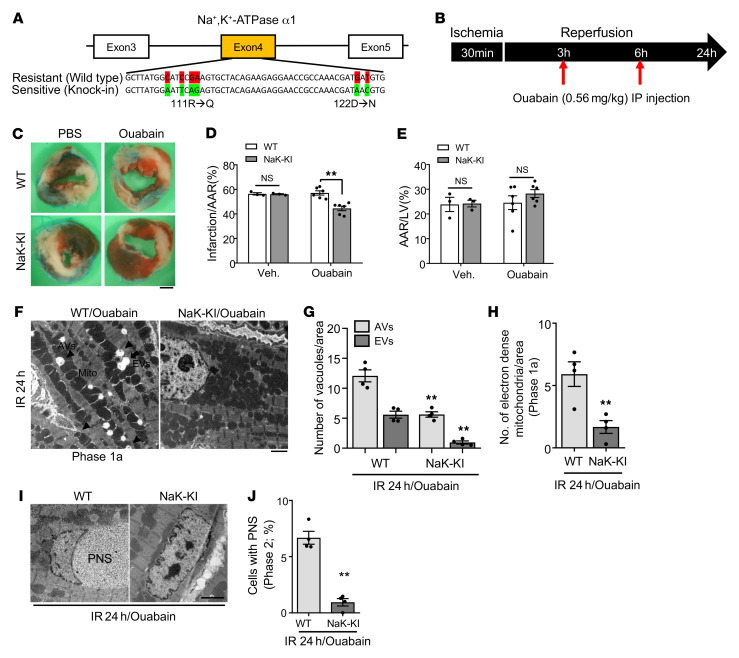
Figure 5. Inhibition of Na+,K+-ATPase α1 activity attenuates I/R injury in the mouse heart.
(A) Schematic diagram of the humanized sequence of Na+,K+-ATPase used to produce the Na+,K+-ATPase–knockin (NaK-KI) mice. (B) Schematic diagram of the experimental design for injection of ouabain during I/R. (C–E) Three-month-old WT and homozygous NaK-KI mice were subjected to 30 minutes of ischemia and 24 hours of reperfusion. They were injected with PBS or ouabain intraperitoneally as indicated in B. Hearts of PBS- or ouabain-injected WT and NaK-KI mice were subjected to TTC staining. (C) Representative images of LV myocardial sections after Alcian blue and TTC staining (scale bar: 1 mm). Ratios of AAR to total LV (E) and infarction area to AAR (D) were compared in WT and NaK-KI mice with PBS or ouabain injection (mean value ± SEM, n = 3 with PBS injected, n = 6 with ouabain injected; **P < 0.01, 2-way ANOVA). (F–J) Twenty-four hours after reperfusion, ouabain-injected WT and NaK-KI mice were subjected to EM analyses. (F) Representative images show AVs (arrowheads) and EVs (arrow) (scale bar: 2 μm). Cytoplasmic AVs and EVs (G) and electron-dense mitochondria (H) were counted. (I) Representative images of CM nuclei showing ballooning of the PNS (scale bar: 2 μm). (J) Percentage of cells with ballooning of the PNS was calculated. Mean ± SEM, n = 4; **P < 0.01 versus ouabain-injected WT; values were measured from more than 10 different areas (G and H) and more than 100 CM nuclei (J) per mouse; 2-way ANOVA (G) and unpaired Student’s t test (H and J). See also Supplemental Figure 5.

