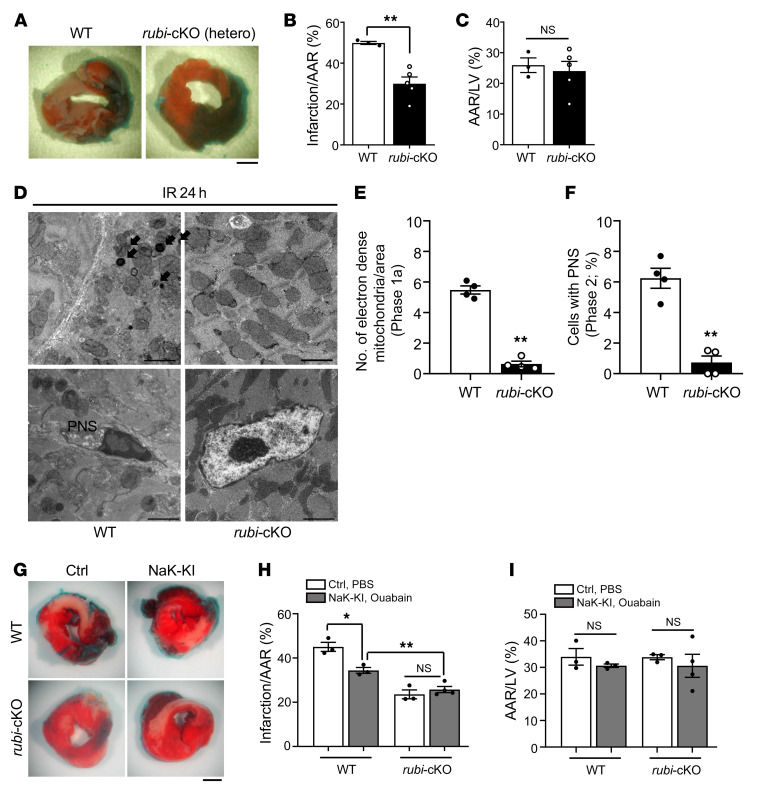
Figure 7. Cardiac tissue–specific knockout of Rubicon attenuated I/R injury and reduced autosis in the mouse heart.
Three-month-old WT (Rubiconfl/+ without αMHC-Cre) and cardiac tissue–specific Rubicon heterozygous knockout (rubi-cKO [hetero]) mice were subjected to 30 minutes of ischemia and 24 hours of reperfusion. Mice were subjected to TTC staining (A–C) or subjected to EM analyses (D–F). (A) Representative images of LV myocardial sections after Alcian blue and TTC staining (scale bar: 1 mm). Ratios of the infarction area to AAR (B) and AAR to total LV (C) were compared in WT and rubi-cKO mice (mean ± SEM, n = 3 WT and n = 5 rubi-cKO; **P < 0.01, unpaired Student’s t test). (D) Electron-dense mitochondria (arrows) and ballooning of the PNS are indicated (scale bars: 2 μm). Electron-dense mitochondria (E) and cells with PNS (F) were counted; mean ± SEM, n = 4; **P < 0.01 versus WT, unpaired Student’s t test; values were measured from more than 10 different areas (E) and more than 100 CM nuclei (F) per mouse. (G–I) Three-month-old WT (Rubiconfl/+ without αMHC-Cre), homozygous NaK-KI (humanized Na+,K+-ATPase–knockin with Rubiconfl/+ without αMHC-Cre), rubi-cKO (Rubiconfl/+ with αMHC-Cre), and homozygous NaK-KI/rubi-cKO (humanized Na+,K+-ATPase–knockin with Rubiconfl/+ with αMHC-Cre) mice were subjected to 30 minutes of ischemia and 24 hours of reperfusion. They received intraperitoneal injection of PBS or ouabain, as indicated in Figure 5B. (G) Hearts were subjected to TTC staining. Representative images of LV myocardial sections after Alcian blue and TTC staining (scale bar: 1 mm). Ratios of the AAR to total LV (I) and infarction area to AAR (H) were compared in WT and NaK-KI mice or rubi-cKO and NaK-KI/rubi-cKO mice with either PBS or ouabain injection (mean ± SEM; *P < 0.05, **P < 0.01, 2-way ANOVA). See also Supplemental Figure 7.

