
Figure 11.
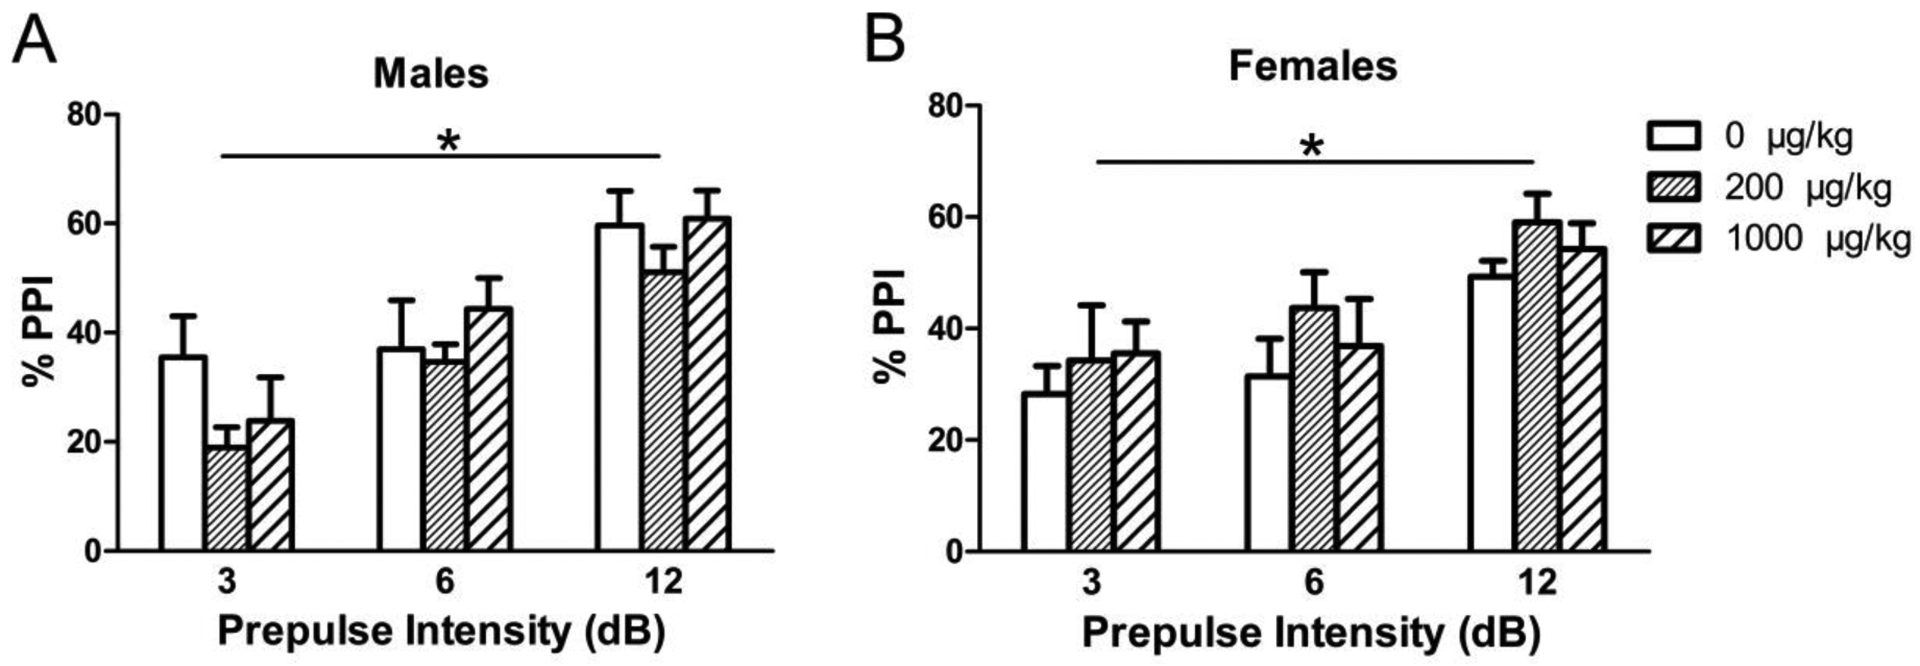
Prepulse inhibition response shown as %PPI at various prepulse intensities (3, 6, and 12 dB) in (A) males and (B) females exposed to phthalates during adolescence. Bars show mean ± standard error of the mean for 10–11 per group. *p < 0.001.