
FIGURE 2.
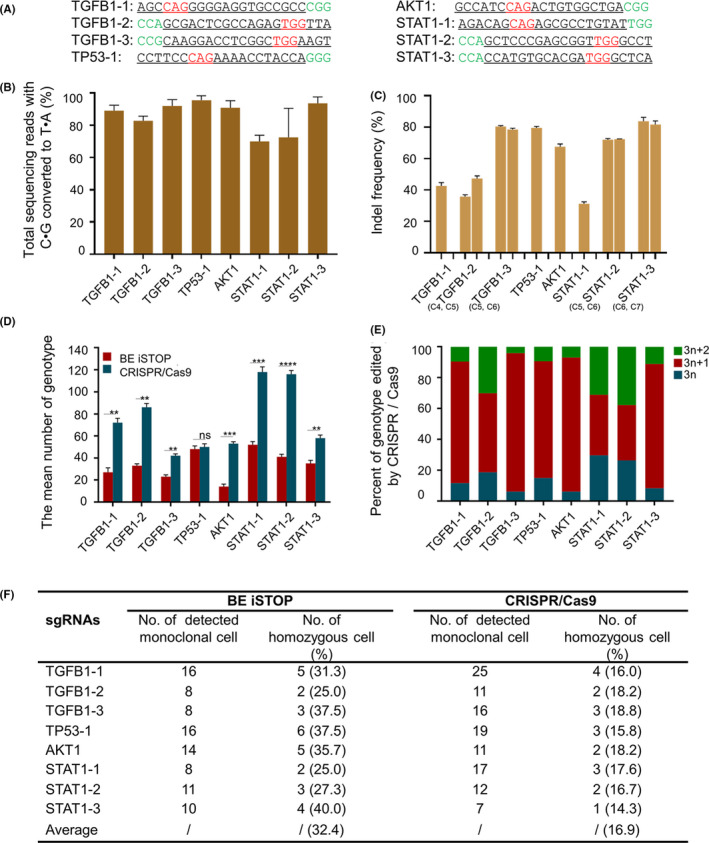
CRISPR/Cas9‐mediated frameshift yields more genotypes than BE‐mediated iSTOP. (A) The used genes and related sgRNA sequences. PAM sequences are highlighted in green. The targeting sequences are underlined. (B) The editing efficiency of BE3‐edited cell populations. Cell populations were the top 25% of GFP‐positive collected by FACS. (C) The indel frequency of Cas9‐edited cell populations. Cell populations were the top 25% of GFP‐positive collected by FACS. (D) The number of genotypes is obtained from BE3‐mediated iSTOP or CRISPR/Cas9‐mediated gene editing. The genotypes were counted after filtering genotypes counted less than 0.1%. Data were analysed by Student's t test (**P < .01, ***P < .001, ****P < .0001, ns‐not significant) and shown as mean ± SEM (n = 3 from three independent experiments). (E) Summary of identified monoclonal cells and homozygous cells edited by BE or CRISPR/Cas9. (F) The kinds of genotype for CRISPR/Cas9 edited cells