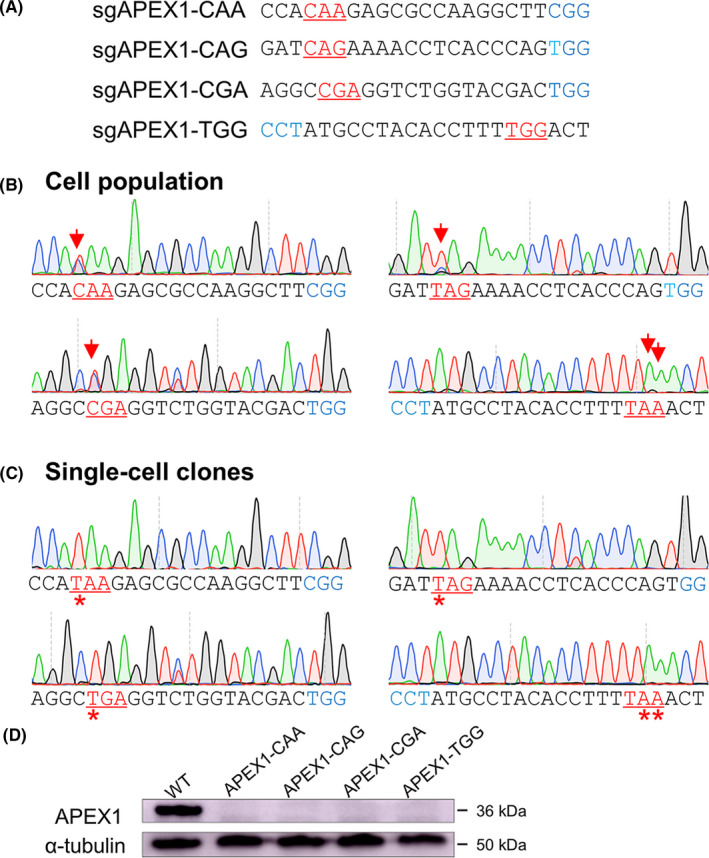
FIGURE 5.

The knockout effects by three potential stop codons. (A) The four sgRNAs for APEX1 harbouring potential stop codons. (B) The Sanger sequencing showed targeting results of four individual APEX1 sgRNAs. The cell population indicated the top 20% of GFP‐positive cells sorted from the whole population of cells. The red arrows show the substituted bases. The iSTOP codons are underlined and highlighted in red, and the PAM sequence in blue. (C) The representative Sanger sequences of four APEX1 knockout single‐cell clones. The red stars show the substituted bases. The iSTOP codons are highlighted in red, and the PAM sequence in blue. (D) The Western blot analysis of APEX1 expression of APEX1 knockout single‐cell clones
