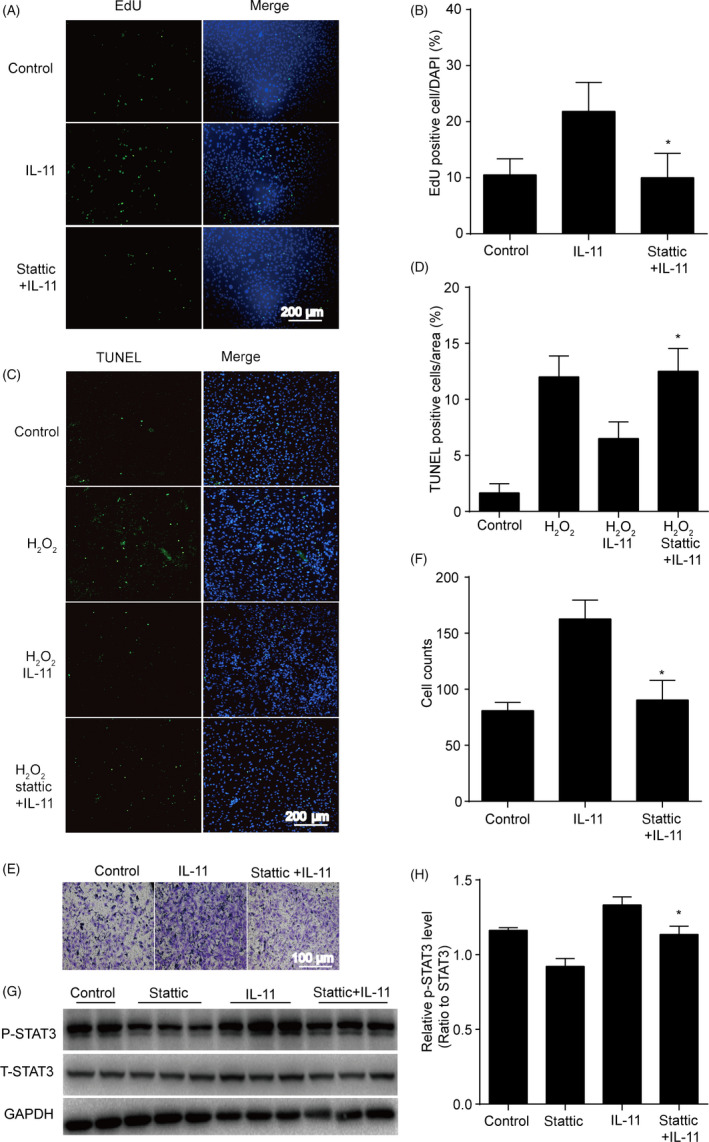
Figure 4.

IL‐11 induced ADSCs proliferation, migration and anti‐apoptotic effects via STAT3 signalling pathway. A and B, Representative images and quantitative analysis of ADSCs proliferation. EdU assay was performed 24 h after IL‐11 (20 ng/mL) or IL‐11 + stattic (2 μmol/L) treatment. *P < .05 vs IL‐11. Two‐way ANOVA followed by Dunnett's post hoc test for statistical analyses; C and D, representative images and quantitative analysis of ADSCs apoptosis. TUNEL staining assay was performed 24 h in ADSCs after IL‐11 (20 ng/mL) or IL‐11 + stattic (2 μmol/L) treatment. H2O2: 200 μmol/L, 24 h. *P < .05 vs H2O2 + IL‐11. Two‐way ANOVA followed by Dunnett's post hoc test for statistical analyses; E and F, Cell migration analysis assessed by transwell assay 12 h in ADSCs with H2O2 after IL‐11 (20 ng/mL) or IL‐11 + stattic (2 μmol/L) treatment. *P < .05 vs IL‐11. Two‐way ANOVA followed by Dunnett's post hoc test for statistical analyses; G and H, Western blots and quantification protein expression of P‐STAT3 in ADSCs after IL‐11 (20 ng/mL) or IL‐11 + stattic (2 μmol/L) treatment. *P < .05 vs IL‐11. Unpaired Student's t test for statistical analyses; (n = 5 different fields, At least three independent experiments were performed)
