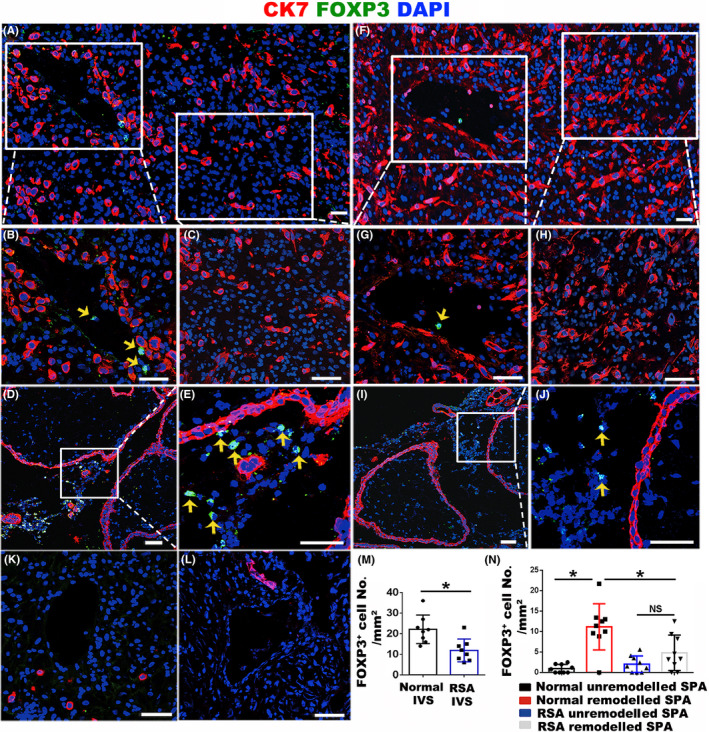
FIGURE 1.

Distribution and proportion of Tregs at the maternal‐foetal interface in healthy and RSA pregnancies at gestational weeks 7‐8. A, Immunofluorescent staining of CK7 (red) and FOXP3 (green) in normal pregnant decidua. B, C, Enlargement of the areas as indicated in panel a, showing remodelled SPA (B) and the area nearby the remodelled SPA (C). D, E, Immunofluorescent staining of CK7 (red) and FOXP3 (green) in placental villi of normal pregnancy and the enlargement of the IVS area are shown in panel E. F, Immunofluorescent staining of CK7 (red) and FOXP3 (green) in RSA decidua. G, H, Enlargement of the areas as indicated in panel F, showing remodelled SPA (G) and the area nearby the remodelled SPA (H). I, J, Immunofluorescent staining of CK7 (red) and FOXP3 (green) in placental villi of RSA pregnancy and the enlargement of the IVS area are shown in panel J. K, L, Immunofluorescent staining of CK7 (red) and FOXP3 (green) in unremodelled SPA of normal pregnancy (K) and RSA pregnancy (L). M, N, The statistical analysis of FOXP3+ Treg number in a unit area of IVS (M) and SPA (N) in normal and RSA pregnancies. Three random views from each case were counted, and results from 3 pairs of normal and RSA cases were statistically analysed using ANOVA. Data are presented as mean ± SD. *P < .05. Scale bars indicate 100 μm. Yellow arrows indicate FOXP3+ Tregs
