
FIGURE 2.
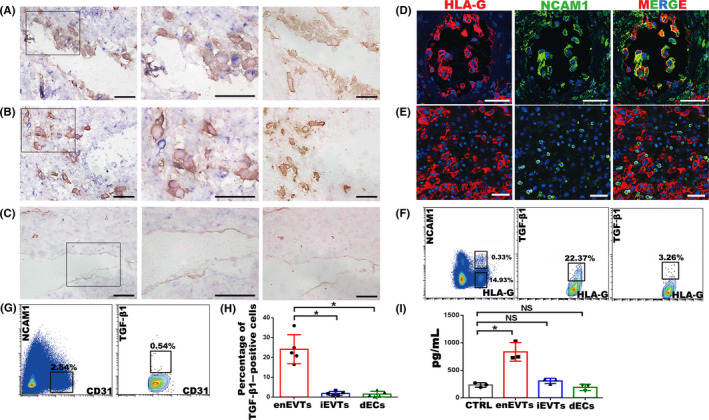
Identification of TGF‐β1–producing cells at the maternal‐foetal interface in normal pregnancy at gestational weeks 7‐9. A‐C, In situ hybridization of TGF‐β1 (blue) and immunohistochemistry staining of HLA‐G (yellow in A and B) or CD31 (yellow in C) in normal pregnant decidua. Middle panels are enlargement of the rectangular areas in left panels, showing the enEVTs in remodelled SPA (A), iEVTs in the area nearby the remodelled SPA (B) and dECs in unremodelled SPA (C). Right panels are negative control of in situ hybridization, with the immunohistochemistry signals of HLA‐G (A, B) or CD31 (C). D, E, Immunofluorescence of HLA‐G (red) and NCAM1 (green) in remodelled SPA (D) and the area nearby remodelled SPA (E). F, Flow cytometry of TGF‐β1 expression in EVTs of normal pregnancy. Left panel, FACS isolation of enEVTs and iEVTs with antibodies against HLA‐G and NCAM1. Middle panel, flow cytometry of TGF‐β1–positive enEVTs that are gated from the left panel as HLA‐G+NCAM1+. Right panel: flow cytometry analysis of TGF‐β1–positive iEVTs that were gated from the left panel as HLA‐G+NCAM1−. G, FACS isolation of CD31+NCAM1− dECs in normal pregnancy (left panel), and flow cytometry of TGF‐β1–positive dECs gated from the left panel as CD31+NCAM1− (right panel). H, The statistical analysis of TGF‐β1–positive primary cells based on the results from 5 normal pregnant cases. I, ELISA for TGF‐β1 in supernatants of the FACS‐sorted enEVTs, iEVTs and dECs (n = 3). The foetal bovine serum in cell‐free media also contains TGF‐β1, so the cell‐free media was set as a control group (CTRL). Data are presented as mean ± SD, and comparison between groups was performed with Student's t test. *P < .05. NS, no significance. Scale bars indicate 100 μm