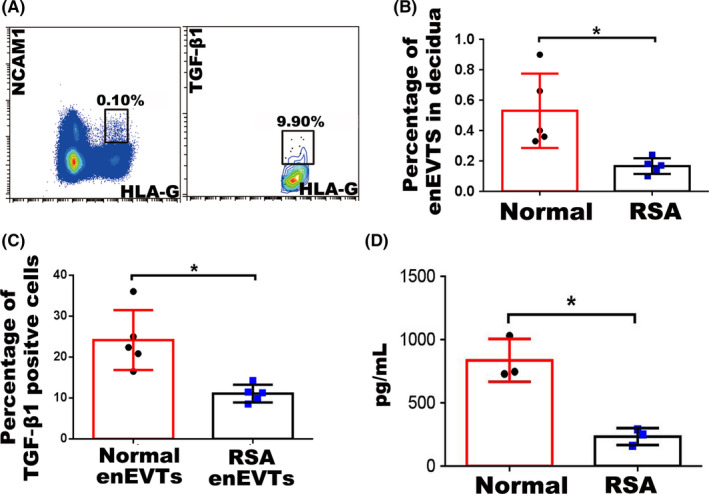
FIGURE 3.

The number of enEVTs and TGF‐β1–producing enEVTs in RSA pregnancy. A, Flow cytometry of enEVTs with antibodies against HLA‐G and NCAM1 in RSA pregnancy (left panel). Flow cytometry of TGF‐β1–positive enEVTs that are gated from the left panel as HLA‐G+NCAM1+ in RSA pregnancy (right panel). B, The statistical analysis of the number of enEVTs in normal (n = 5) and RSA (n = 5) pregnancy. C, The statistical analysis of the proportion of TGF‐β1–producing enEVTs in normal (n = 5) and RSA (n = 5) pregnancy. D, ELISA for TGF‐β1 in supernatants of the normal enEVTs (n = 3) and RSA enEVTs (n = 3). Data are presented as mean ± SD, and comparison between groups was performed with Student's t test. *, P < .05
