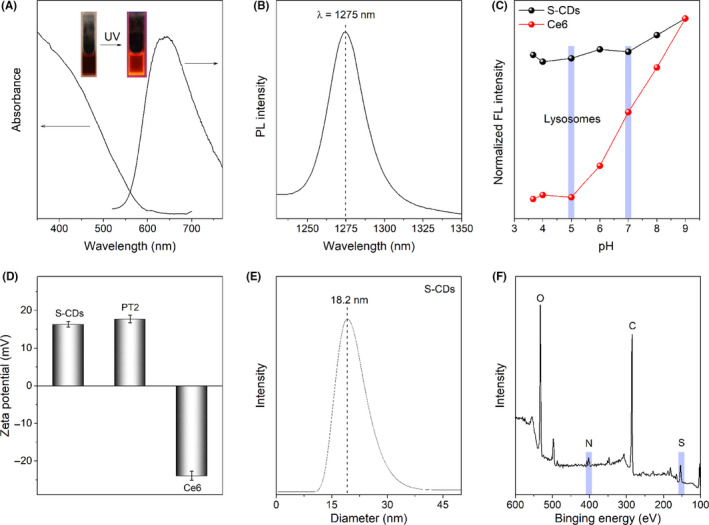
Figure 1.

Characterization of S‐CDs: A, UV − vis absorption and fluorescence emission spectra (λex = 420 nm); B, Characterized 1O2 phosphorescence emissions at 1275 nm (CH3CN‐D2O mixture solvent, 15:1, V/V); C, Fluorescence intensity of the S‐CDs, Ce6 and PT2 in the pH range from 3.7 to 9; D, Zeta potential of S‐CDs, Ce6 and PT2; E, Dynamic light scattering; and F, XPS survey spectrum of the S‐CDs
