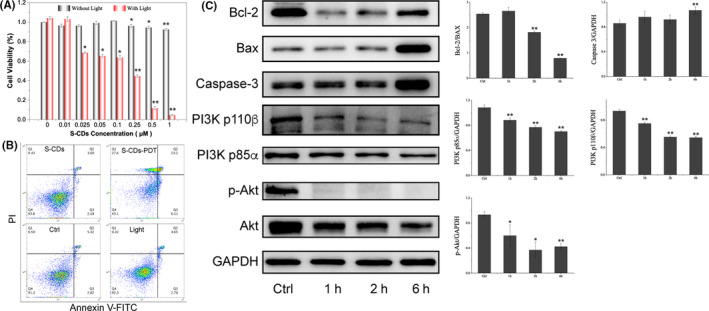
Figure 6.

A375 response to S‐CDs mediated PDT. A, Cell viability of A375 after S‐CDs mediated PDT in the concentration range 0.01‐1 µmol/L; B, Cell apoptosis analysis of S‐CDs mediated PDT by Annexin V‐FITC/PI staining and subsequent flow cytometry assay; C, Western blot images and quantitative analysis of the apoptotic proteins (Bcl‐2, Bax and caspase‐3) and PI3K/Akt signalling proteins after S‐CDs mediated PDT. Data are presented as mean ± SD (n = 3). Statistical analysis: *P < .05. **P < .01
