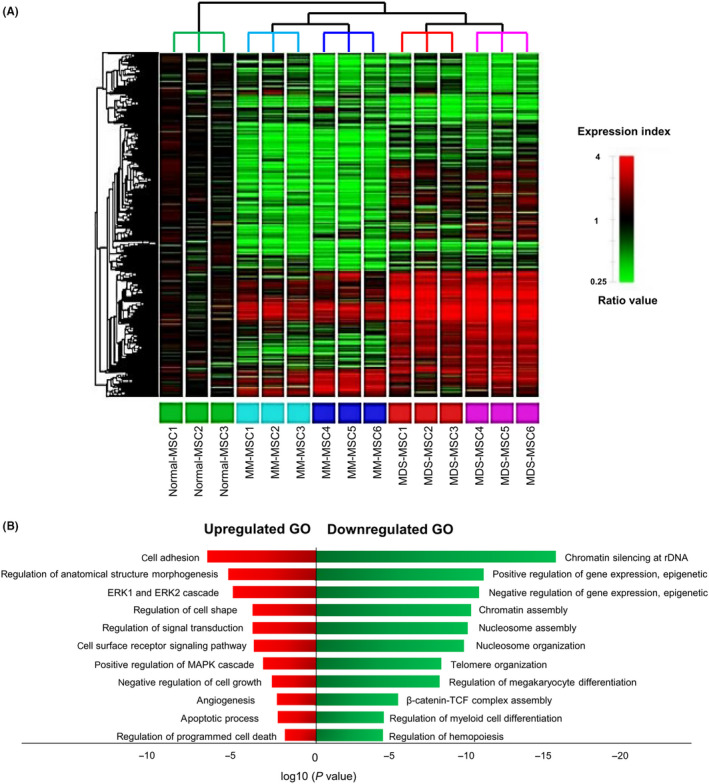
Figure 2.

Gene expression profiles in bone marrow mesenchymal stromal cells (BM‐MSCs) derived from normal (n = 3) and patients with myelodysplastic syndrome (MDS, n = 6) and multiple myeloma (MM, n = 6). (A) Heat map showing differentially expressed genes relative to normal BM‐MSCs. Red spots indicate upregulated transcripts. Green spots indicate downregulated transcripts. The dendrogram is derived by unsupervised hierarchical clustering of gene expression distinguishing MDS‐MSCs from MM‐MSCs. Further clustering showed distinct groupings between BM‐MSCs that continued to proliferate after passage 6 (P6) and those that stopped to proliferate before P6. (B) General functional classification of common genes with expression level changed more than 2‐fold in MDS‐MSCs and MM‐MSCs compared to normal BM‐MSCs. Gene Ontology (GO) analysis within target genes of significantly altered transcripts was performed using the database for annotation, visualization and integrated discovery (DAVID) bioinformatics tool. Enriched GO biological processes were identified and listed according to their enrichment P value (P < .05) and False discovery rate (FDR < 0.25). Both P and FDR values were obtained using DAVID 2.1 statistical function classification tool
