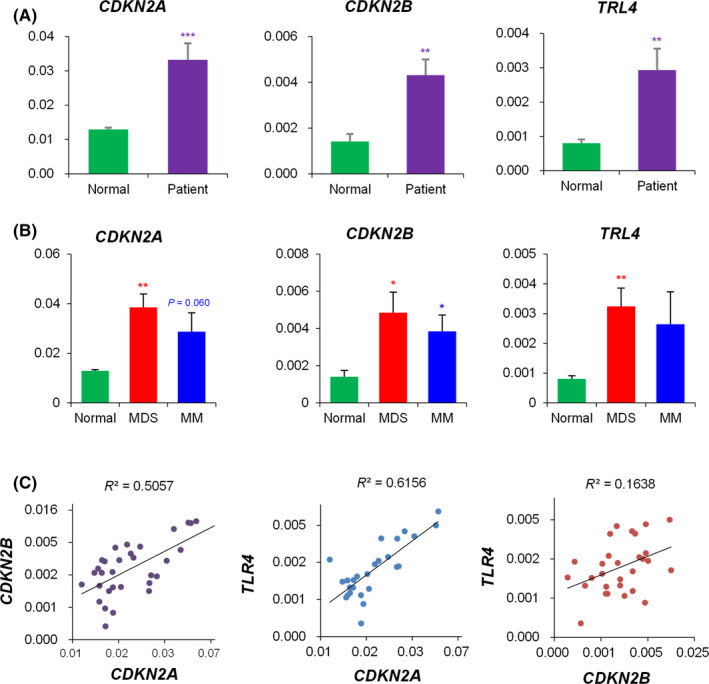
Figure 3.

Expression levels of CDKN2A, CDKN2B and TLR4 genes and their correlations. (A) Comparison of gene expression between normal control and patient's bone marrow mesenchymal stromal cells (BM‐MSCs), (B) Comparison of gene expression of BM‐MSCs from normal controls, myelodysplastic syndrome (MDS) and multiple myeloma (MM) patients, quantified by RT‐qPCR. Experiments were performed in technical triplicates. Results are presented as mean ± SEM calculated from data obtained from independent samples of normal (n = 9), MDS (n = 12) and MM (n = 14). GAPDH gene was used as an endogenous control. (*P < .05, **P < .01, ***P < .001). (C) Correlation between CDKN2A, CDKN2B and TLR4 gene expression
