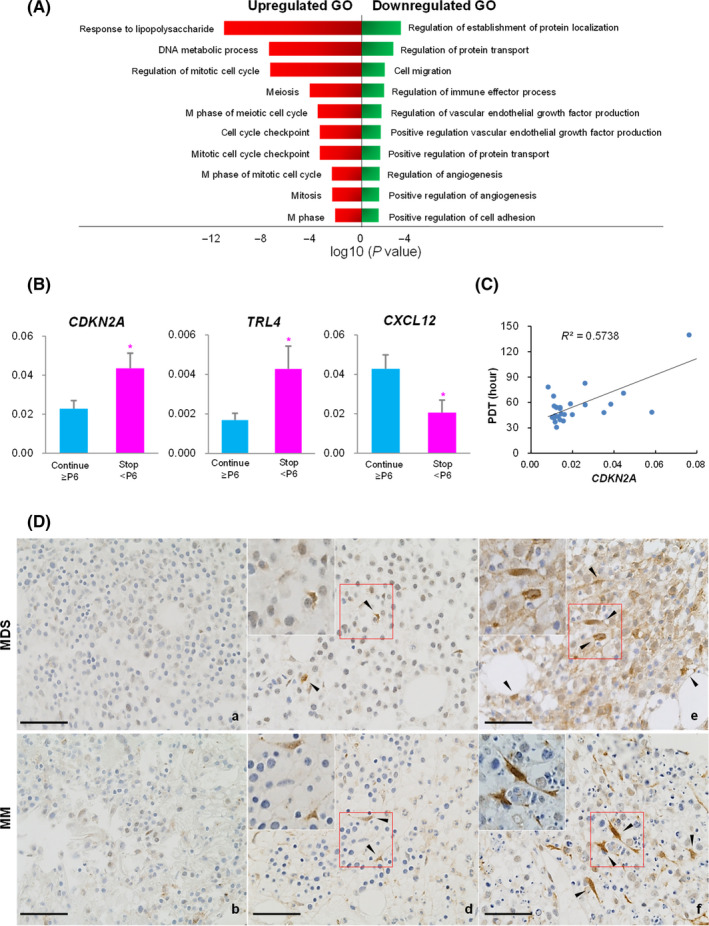
Figure 4.

(A) Enriched Gene Ontology (GO) of genes upregulated and downregulated in patient's bone marrow mesenchymal stromal cells (BM‐MSCs) that continued to proliferate after passage 6 (Continue ≥ P6) compared to those that stopped to proliferate before P6 (Stop < P6). (B) Comparison of CDKN2A, TLR4, and CXCL12 expression in patient's BM‐MSCs between Continue ≥ P6 and Stop < P6 groups quantified by RT‐qPCR. Experiments were performed in technical triplicates. Results are presented as mean ± SEM calculated from data obtained from independent samples of patients with myelodysplastic syndrome (MDS, n = 12) or multiple myeloma (MM, n = 14). GAPDH gene was used as an endogenous control (*P < .05). (C) Correlation between CDKN2A expression and population doubling time (PDT) at P4. (D) Immunohistochemical staining of CDKN2A (stained brown) in BM biopsy sections from MDS and MM patients. Arrow heads indicate CDKN2A immunoreactive cells. Upper left square of each figure is magnification of red box. (a, b) Continue ≥ P6, (c, d) Stop < P6 and (e, f) Failure in colony formation. Images were obtained with a Carl Zeiss Microscopy GmbH (Carl Zeiss, Jena, Germany) equipped with a ProgRes MF camera (JENOPTIK, Jena, Germany). Original magnification, 400×. Scale bars, 100 μm
