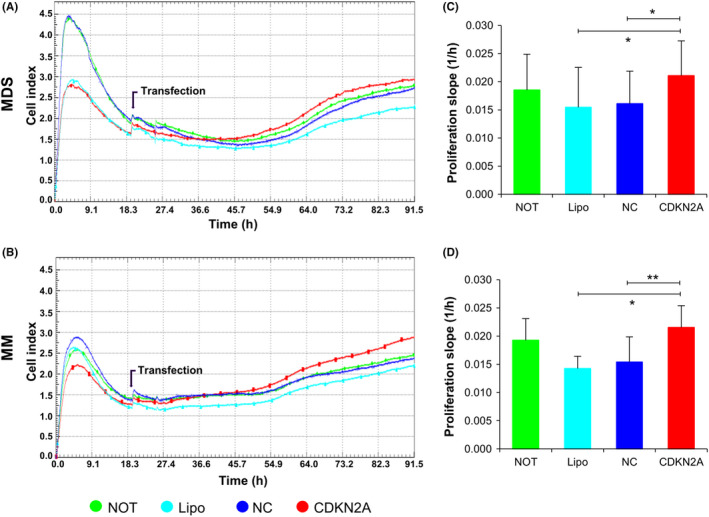
Figure 5.

Real‐time monitoring of proliferation after CDKN2A knockdown (red line) using the xCELLigence assay compared with untreated (NOT, green), lipofectamine treated (Lipo, light blue) and negative control (NC)‐siRNA transfected (blue) bone marrow mesenchymal stromal cells (BM‐MSC) from myelodysplastic syndrome (MDS) and multiple myeloma (MM) for 72 hrs. Representative data by three technical replicates (A, B) and the mean and SE from the six independent donors (C, D). *P < .05, ** P < .01
