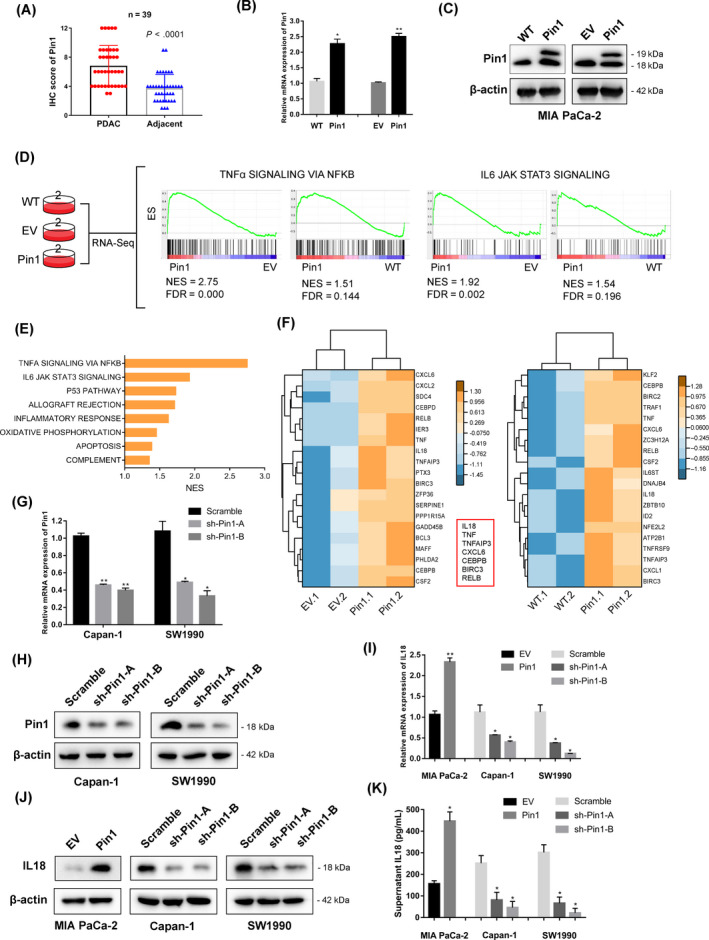
FIGURE 1.

Pin1 potentially regulates NF‐κB cascade and IL‐18 expression in pancreatic cancer cells. (A) Pin1 expression in PDAC and adjacent normal tissues, as determined by the IHC score (n = 39, P < .0001). (B) Analysis of relative gene expression data of Pin1 using real‐time quantitative PCR and the 2−ΔΔCt method in MIA PaCa‐2 cell lines. (C) Analysis of protein expression of Pin1 using Western blotting assay in MIA PaCa‐2 cell lines. (D) Transcriptome strategy of RNA sequencing conducted on MIA PaCa‐2 cells. Each group contains two biological replicates. Gene set enrichment analysis (GSEA) was used to analyse the signalling pathways enrichment in different groups. Normalized enrichment score (NES) indicated the analysis results across gene sets. False discovery rate (FDR) presented if a set was significantly enriched. ES, enrichment score. (E) The core‐enriched increased signalling pathways in Pin1‐overexpressing cells compared with EV control. The NES values of the pathways with P < .05 are presented. (F) Heat maps show upregulation of “TNFα SIGNALING VIA NFKB” response genes in Pin1‐overexpressing cells. Values are row‐scaled to show relative expression. Blue and yellow are low and high levels, respectively. Red rectangular box showed the mutual upregulated genes in Pin1‐overexpressing cells comparing to WT and EV, respectively. (G) qRT‐PCR analysis of Pin1 knockdown efficiency in Capan‐1 and SW1990 cell lines that stably express shRNA oligos against Pin1. (H) Western blot analysis further confirmed the silencing efficacy. (I) The IL‐18 mRNA levels in PDAC cells were determined following the silencing or overexpression of Pin1 and compared with the controls. (J) The expression of IL‐18 was determined by Western blot analysis. (K) Supernatant was collected and analysed by ELISA for IL‐18 protein expression after cultivation for 24 h. *P < .05, **P < .01
