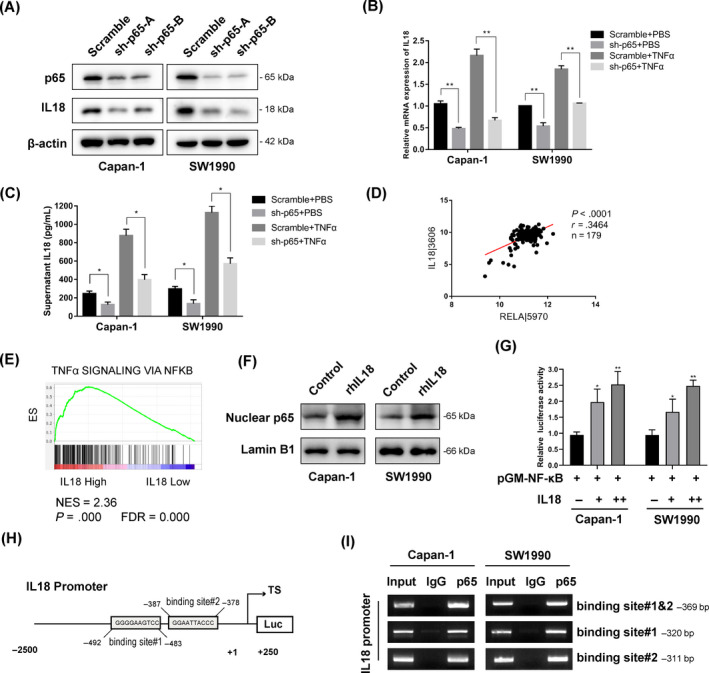
FIGURE 5.

p65 transcriptionally activates IL‐18 expression in pancreatic cancer cells. (A) The expression of p65 and IL‐18 was determined by Western blot analysis. (B) Scramble and sh‐p65 cells were stimulated with TNFα (25 ng/mL) or PBS for 4 h. Total RNA was isolated, and qRT‐PCR was performed to determine the relative IL‐18 mRNA expression (*P < .05, **P < .01). (C) Scramble and sh‐p65 cells were stimulated with TNFα (25 ng/mL) or PBS for 24 h. Supernatant was collected and analysed by ELISA for IL‐18 protein expression (*P < .05). (D) Positive correlation between the expression of RELA/p65 and the expression of the IL‐18 genes in TCGA database. (E) Gene set enrichment analysis (GSEA) was used to analyse the signalling pathways enrichment in different groups based on IL‐18 gene expression level in TCGA database. Normalized enrichment score (NES) indicated the analysis results across gene sets. False discovery rate (FDR) presented if a set was significantly enriched. ES, enrichment score. (F) Western blot analysis of nuclear p65 protein from cells treated with rhIL‐18. (G) Increase of NF‐κB by IL‐18 upregulation. Cells were cotransfected with IL‐18 vector or control and NF‐κB‐Luc construct, followed by luciferase assay. (H) Schematic representation of the IL‐18 promoter regions has shown that IL‐18 promoter region contains putative p65‐binding elements. (I) ChIP assay results with a p65 antibody demonstrated that p65 occupied the promoter region, which contained p65 binding sites
