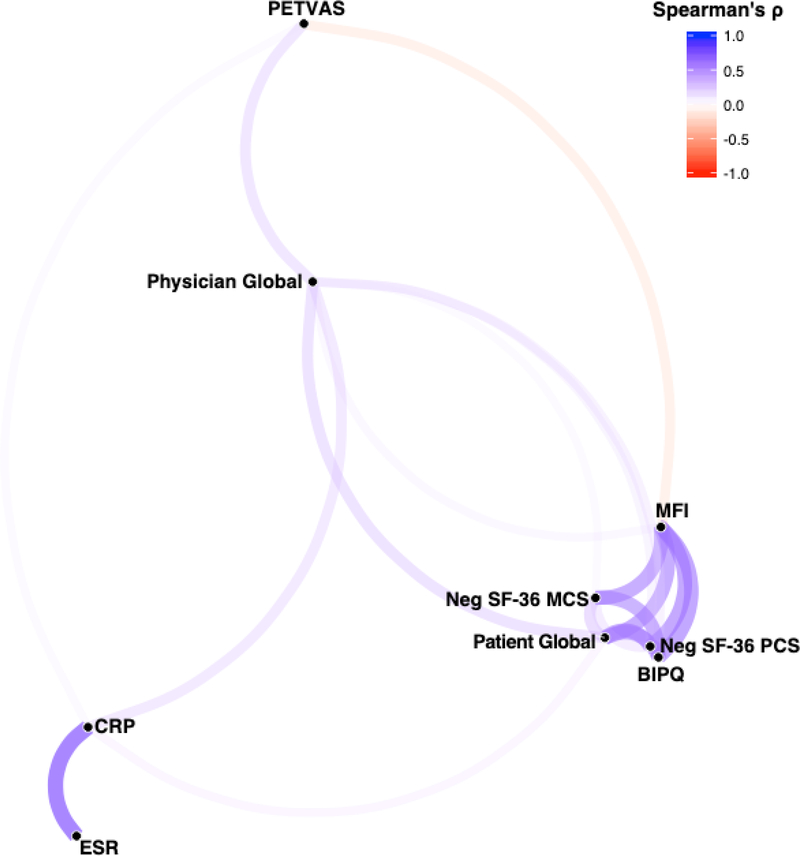
Figure 1. Correlation network of outcome measures in all patients with LVV.
Correlation network of the significant Spearman ρ correlation coefficients (p<0.05) between outcome measures created using the R package corrr. Color and thickness of the edges between nodes indicates the strength of the correlation. Nodes for each outcome measure are clustered in space using multidimensional scaling of the absolute values of the correlations, such that outcome measures with the highest overall magnitude of correlation with each other are closer in space. For ease of visualization, the SF-36 PCS and MCS measures were multiplied by −1 so that a higher score would indicate a worse outcome. MFI= Multi-dimensional fatigue inventory; BIPQ= brief illness perception questionnaire; Neg SF-36 PCS= negatively transformed 36-item short form health survey physical component summary score; Neg SF-36 MCS= negatively transformed 36-item short form health survey mental component summary score; CRP= c-reactive protein; ESR= erythrocyte sedimentation rate; PETVAS= qualitative score of vascular FDG-PET activity.

