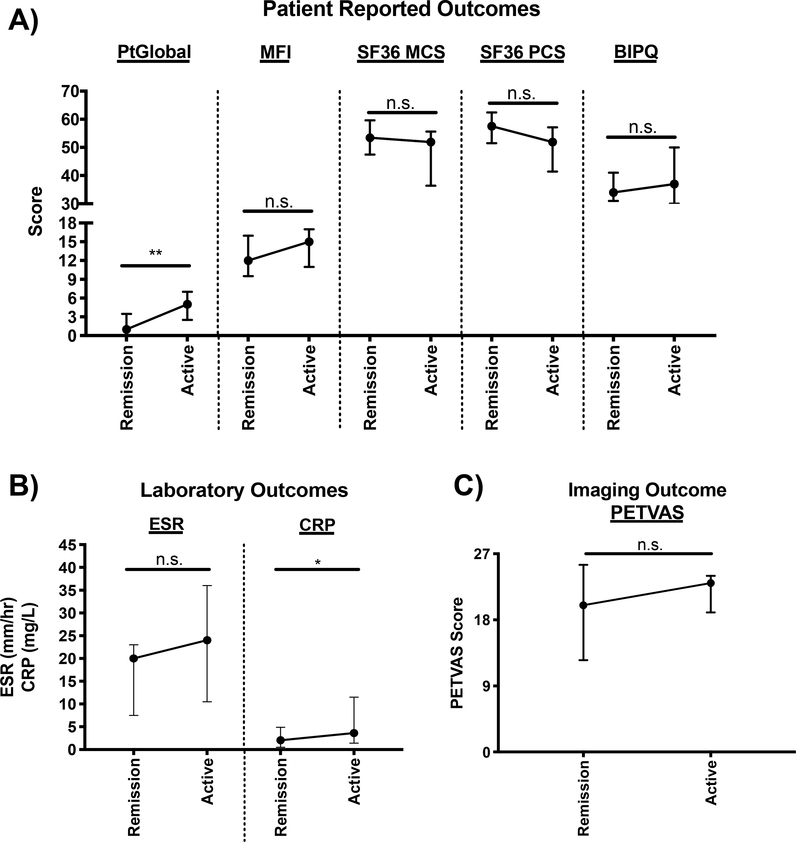
Figure 3. Longitudinal analysis of outcome measures in patients experiencing a change in clinical disease activity from remission to active disease.
(A) Patient reported outcomes, (B) Laboratory Outcomes, and (C) Imaging Outcome. Data is plotted as median and interquartile range and n=8–11. Wilcoxon signed rank test was used to compare outcome measure scores between remission and active visits. *p<0.05, **p<0.01, ***p<0.001, ****p<0.0001, n.s.=not significant. PtGlobal= Patient global assessment; MFI= Multi-dimensional fatigue inventory; SF-36 MCS= 36-item short form health survey mental component summary score; SF-36 PCS= 36-item short form health survey physical component summary score; BIPQ= brief illness perception questionnaire; ESR= erythrocyte sedimentation rate; CRP= c-reactive protein; PETVAS= qualitative score of vascular FDG-PET activity.

