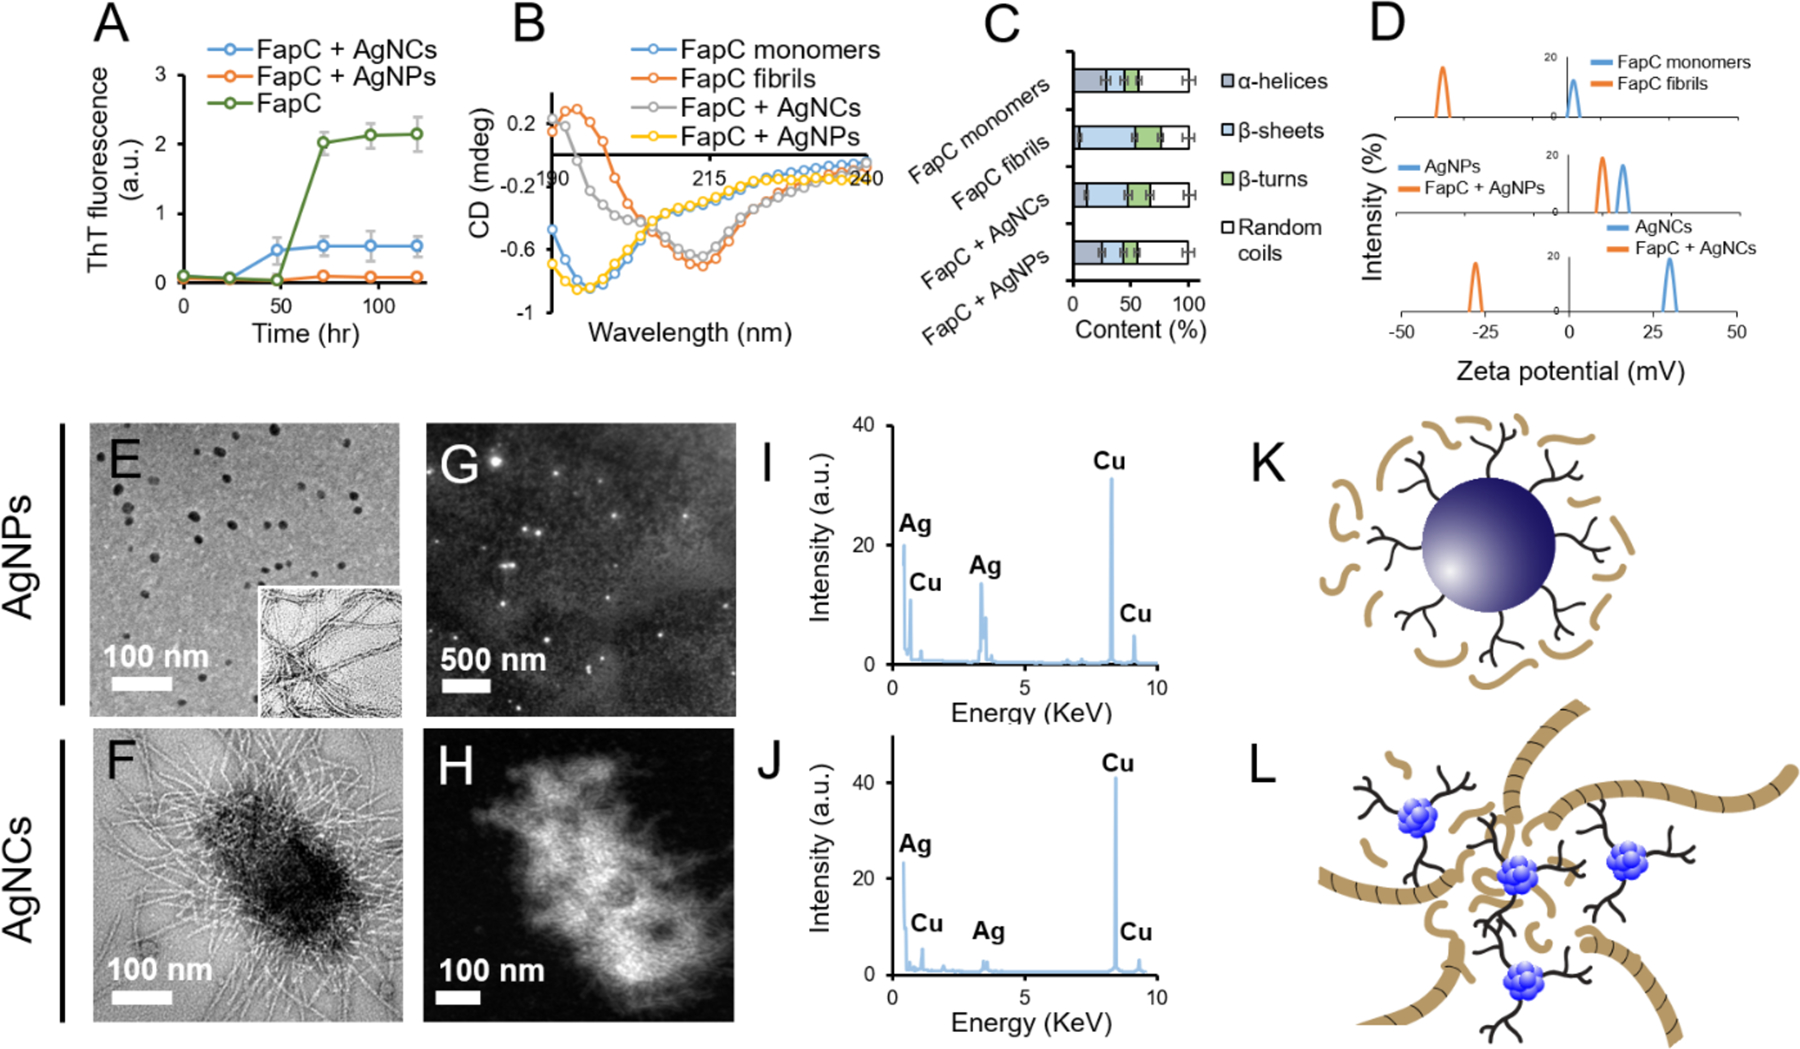
Figure 2. Binding between FapC and bPEI-capped AgNPs or AgNCs.

ThT kinetic assay of FapC mixed with AgNPs or AgNCs (A). CD spectra (B) and percentage secondary structure (C) of FapC monomers, fibrils and FapC monomers after incubation with bPEI-capped AgNPs or AgNCs, calculated using DichroWeb. Changes in the zeta potential of FapC monomers before and after incubation with bPEI-capped AgNPs and AgNCs (D). TEM micrographs of FapC + AgNPs (E) and FapC + AgNCs (F). The inset shows control FapC fibers. Panels G,H and I,J present the respective HAADF images and EDAX spectra of FapC + AgNPs and FapC + AgNCs. Panels K and L represent graphical illustrations of bPEI-capped AgNPs and AgNCs interacting with FapC.
