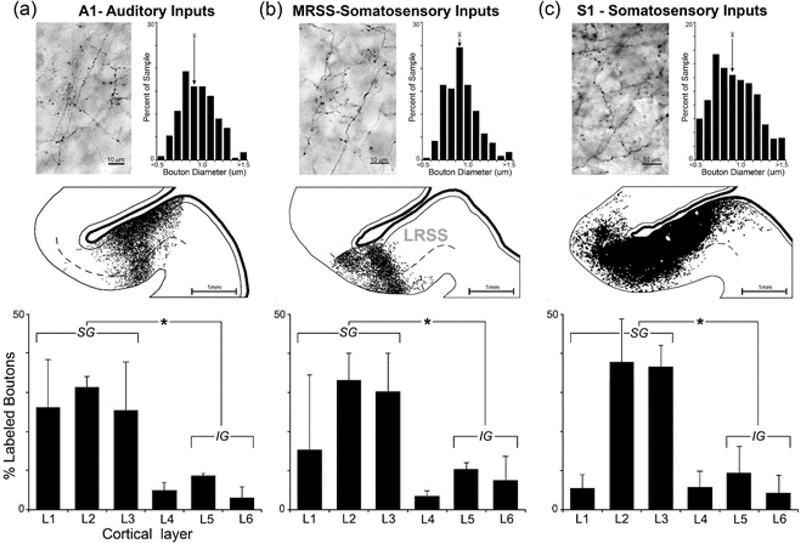
Figure 11.
Laminar pattern of afferent inputs to the LRSS. Panels show data for axon terminals (boutons) orthogradely labeled by tracer injection into (a) auditory cortex-A1; (b) the somatosensory MRSS (this area largely represents head and face; Keniston et al., 2009); and (c) somatosensory S1 (injection of forelimb representation). Each panel displays a photomicrograph of BDA-labeled axons and boutons within the LRSS, next to which is a bar graph illustrating the size and distribution of measured bouton diameters (arrow = average). At mid-panel, a coronal section through the LRSS depicts the distribution of labeled boutons (1 dot=1 bouton) with the grey-white border and Layer 1 (thin black lines) and Layer 4 (dashed line) depicted. The histograms at the bottom quantitatively show the laminar distribution of labeled boutons by plotting the proportion (mean ± sd) of labeled boutons by section (3–7 sections/case) by cortical layer (L1-L6). Asterisks indicate statistically significant (t-test; p<0.001) difference between bouton counts in supragranular (SG; layers 1–3) versus infragranular layers (IG, layers 5–6). For each afferent source, axon terminal distributions were heavily biased toward supragranular locations.

