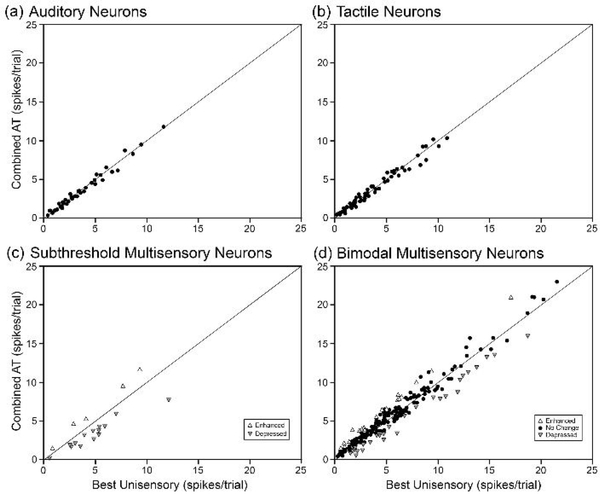
Figure 7.
For each type of sensory neuron (a) auditory, (b) tactile, (c) subthreshold multisensory, and (d) bimodal multisensory, each dot=1 neuron) these graphs plot the response to combined auditory-tactile stimulation (y-axis) against its response to its most effective unisensory stimululs. Note that unisensory auditory and unisensory tactile neurons show no significant change in response to combined stimulation and these responses plot close to the line of unity. In contrast, subthreshold multisensory neurons show significantly increased (enhanced; upward triangle) or decreased (depressed; downward triangle) responses to combined auditory-tactile stimulation and this activity plots away from the line of unity. For bimodal neurons, there is not only an increased level of overall response (e.g., units that plot > 12 spikes/response) over that observed for unisensory neurons, but some also exhibit significant levels of response integration (open symbols for enhancement, depression) while others do not (closed, black dots).

