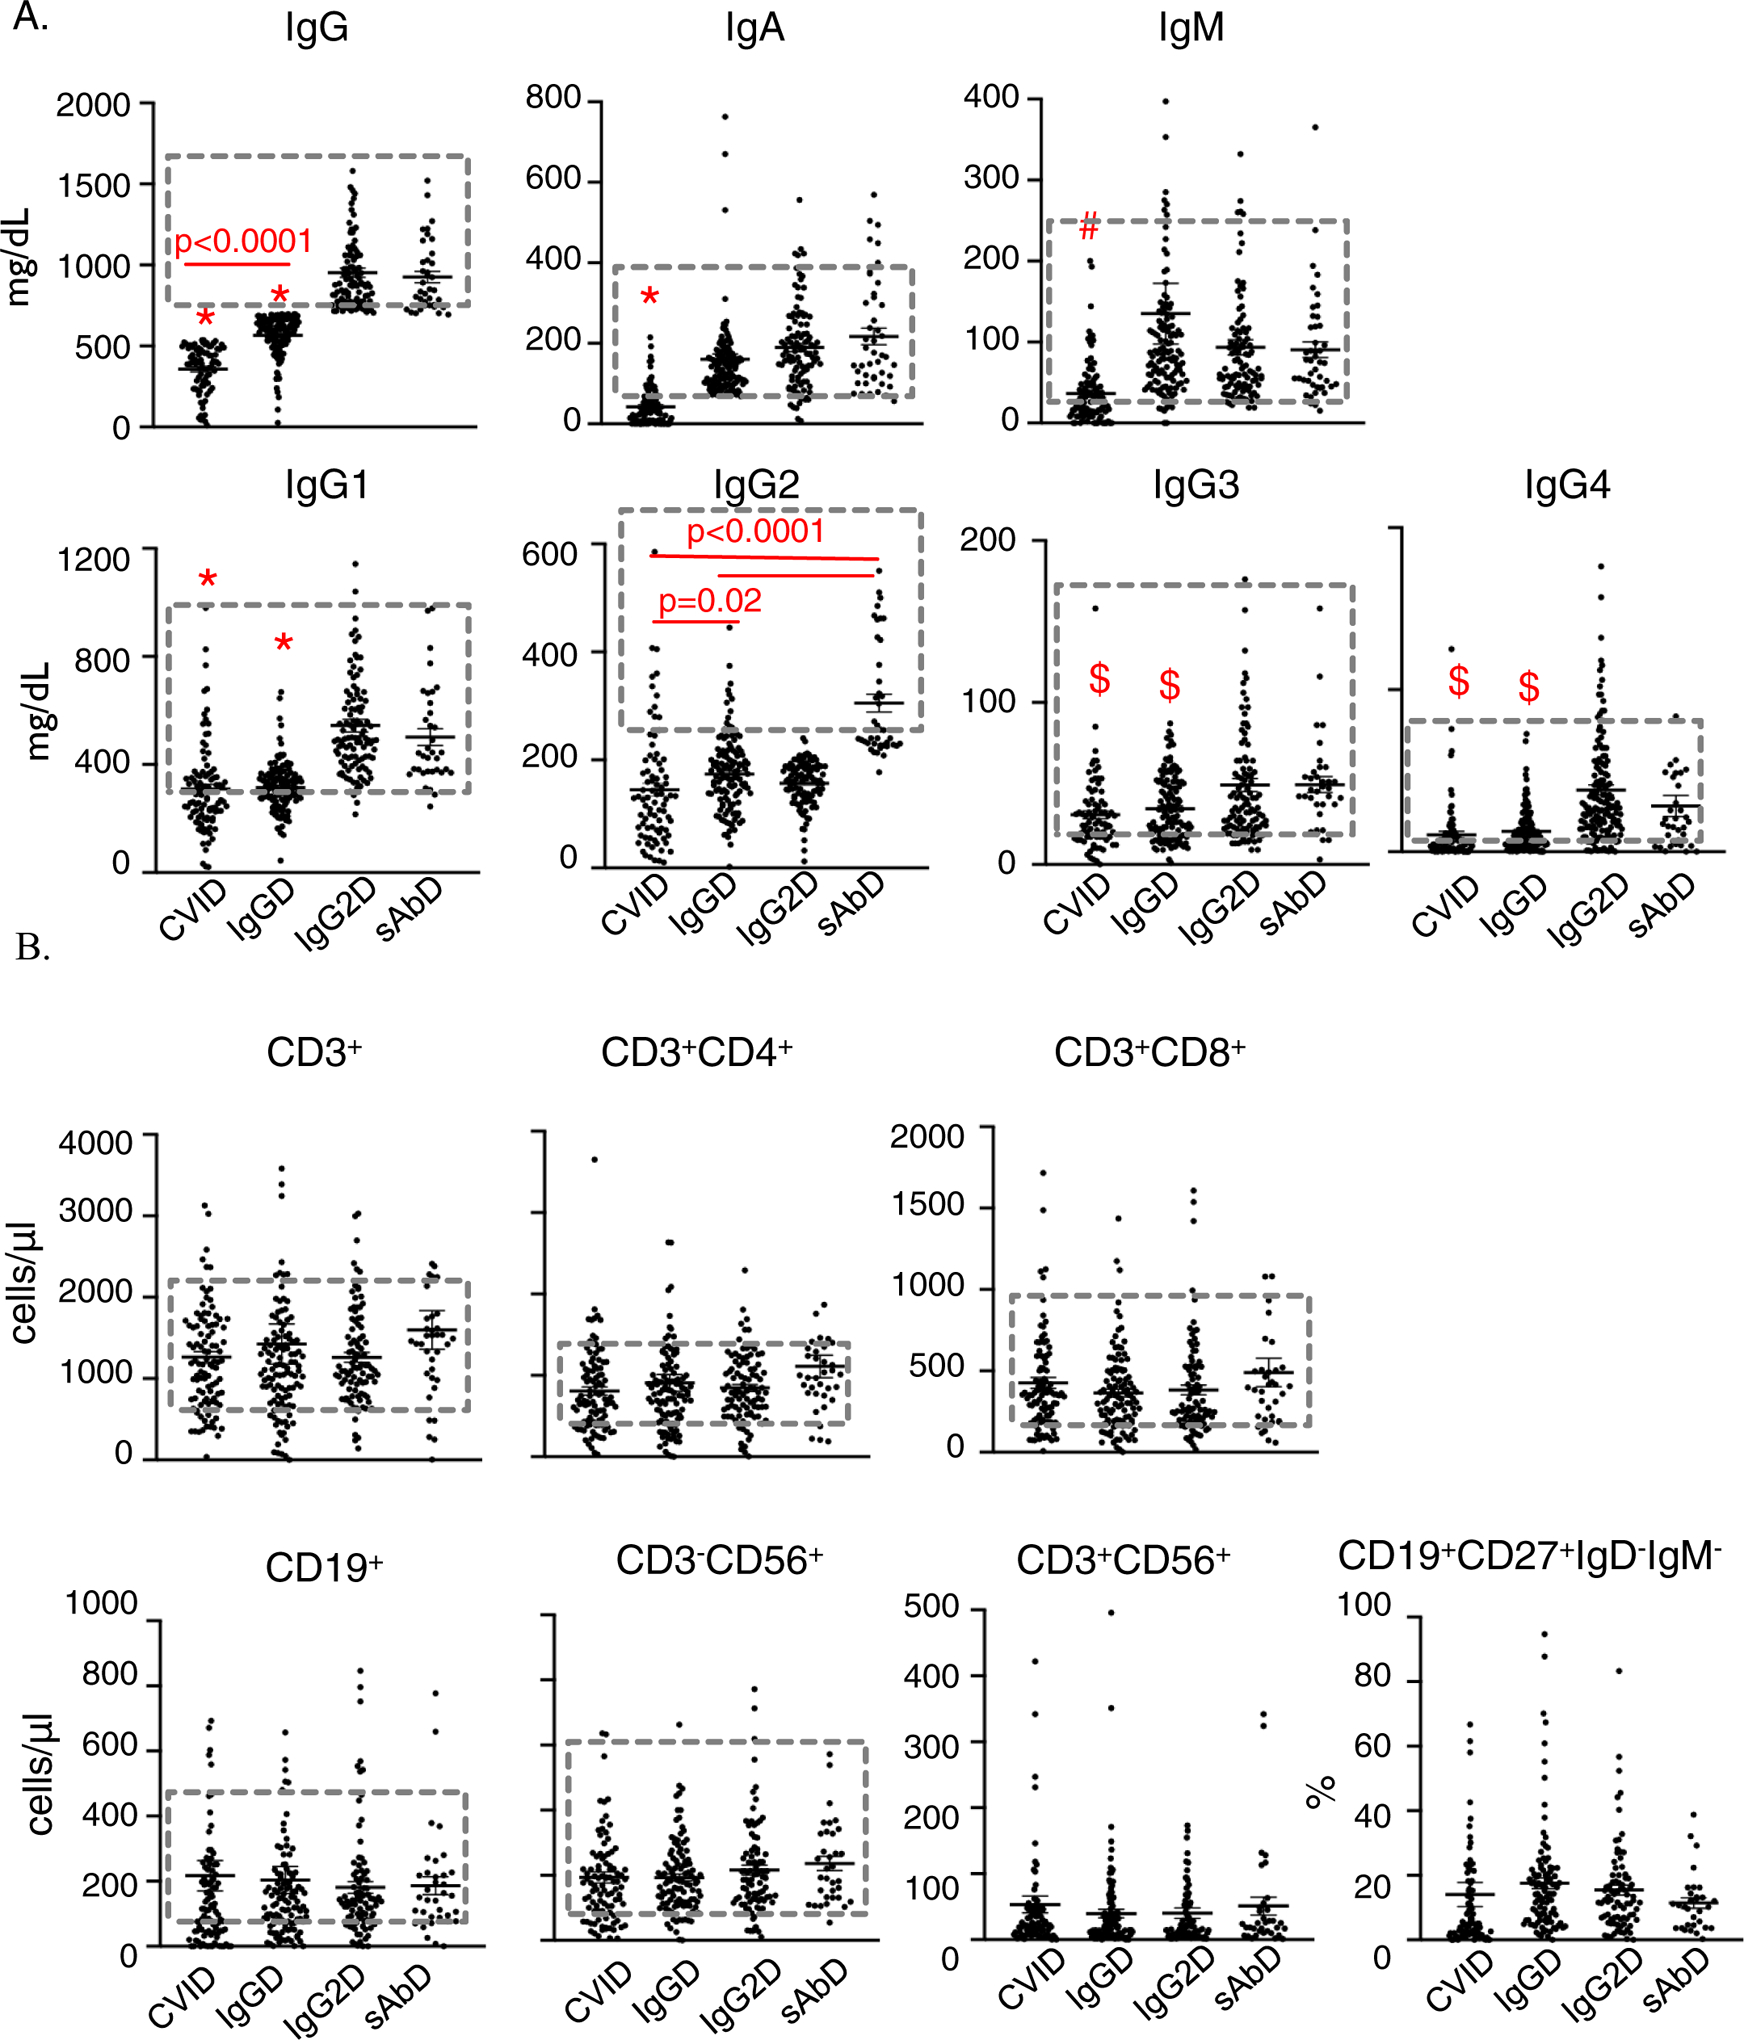
Figure 2. Analysis of serum immunoglobulin levels and peripheral immune cells subsets in patients with different PADs.

(A) *IgG, IgG1 and IgA levels of CVID are significantly lower than the levels of IgGD, IgG2D and sAbD (p<0.0001). *IgG and IgG1 level of IgGD is significantly lower than the level of IgG2D and sAbD (p<0.0001). #IgM level of CVID is significantly lower than the level of IgGD (p=0.035), *IgA level of CVID is significantly lower than IgA levels of IgGD (p<0.0001). $IgG3 and IgG4 levels of CVID and IgGD are significantly lower than the levels in IgG2D and sAbD (p<0.02). (B) Flow cytometric analysis of peripheral immune cell subsets in patients with different PADs were done. Absolute cell counts of peripheral immune cell subsets were determined by flow cytometry. Statistical analysis was done by the one-way ANOVA with the Dunnett’s test for multiple comparisons. Dotted boxes denote the normal range (2 standard deviations from the mean).
