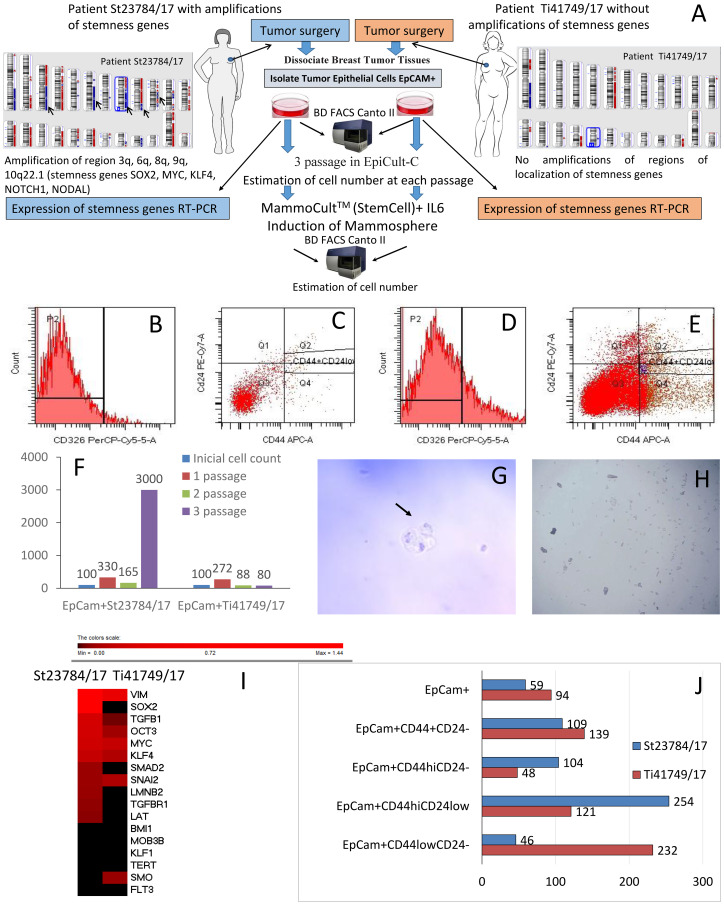
Figure 2. The significance of stemness gene amplifications for stem-like cancer cell activity.
(A) The experimental design and the CNA genetic landscape of tumors in patients St23784/17 and Ti41749/17, showing that St23784/17 had amplifications at the 3q, 6q, 8q, 9q, and 10q22.1 regions of stemness gene localization (the following genes were amplified: SOX2, MYC, KLF4, NOTCH1, NODAL), and Ti41749/17 had no stemness gene amplifications. (B–E) Analysis of the quantitative and qualitative expression of cells obtained from tumor tissue of breast cancer patients. The cells were analyzed by flow cytometry using a FACSCanto II (Becton Dickinson, USA) and FACS Diva software, using CD326 (PerCP-Cy5.5), CD24 (PE-Cy 7), and CD44 (APC) (BD Biosciences, USA) antibodies. (B) Histogram of the IgG1 PerCP Cy5.5 isotope control; (C) isotype control dot-plot for IgG2a PE-Cy 7/IgG2b APC; (D) phenotypic confirmation and qualitative analysis of CD326 (PerCP-Cy5.5) expression in the histogram; (E) phenotypic confirmation and qualitative analysis of CD326+CD44+CD24-\low expression in the dot-plot. (F) The dynamics of the EpCam+ tumor cell mass increase (percentage of the initial number of cells in culture). (G) Nonadherent mammospheres of EpCam+ cancer cell cultures (St23784/17 patient). Mammosphere formation within 10 days. Scale bar, 200 μm. (H) EpCam+ cells without mammosphere formation (patient Ti41749/17). (I) Thermal map of stemness gene expression in the environment enriched with EpCam+ tumor cells from the patients St23784/17 and Ti41749/17. (J) The content of tumor stem cells in the EpCam+ cell enriched environment after a cycle of cultivation and IL-6 treatment (% of the initial cell content in each population).

