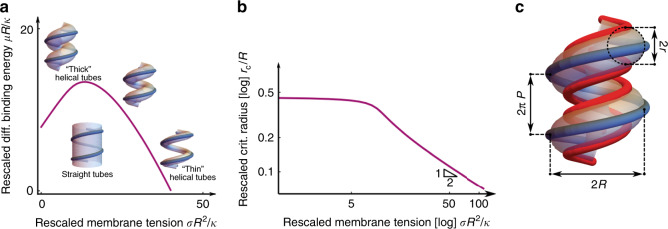
Fig. 4. Mathematical modeling of helical tubes’ mechanical equilibrium.
a Phase diagram showing the energetically favored shape between straight and helical tubes, as a function of the rescaled energy gain μR/κ associated with helical tubes with rescaled membrane tension σR2/κ. The solid purple line is the phase boundary. b Rescaled critical radius rc/R of the tube at the transition from straight to helical as a function of the rescaled surface tension σR2/κ. c Schematic of the more detailed filament elasticity model, which clusters together the filaments bound in the equatorial (blue) and polar modes (red). Source data are provided as a Source Data file.

