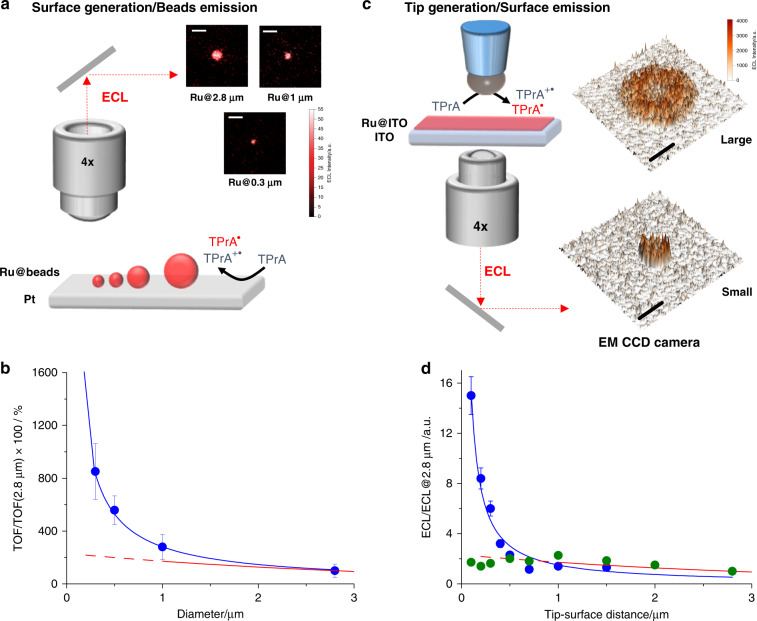
Fig. 2. Spatial map of electrochemiluminescence (ECL) emission.
a Schematic representation of the surface generation–bead emission experiment where Ru@beads are magnetic beads labeled with [Ru(bpy)3]2+ on platinum electrode (Pt) and b turnover frequency (TOF) as a function of bead size (blue curve and dots) and ECL intensity of the ref. 23 (red curve). The inset in a shows the ECL images acquired for beads with different sizes where Ru@2.8 μm, Ru@1 μm and Ru@0.3 μm are ECL images of magnetic beads labeled with [Ru(bpy)3]2+ with a diameter of 2.8, 1, and 0.3 μm, respectively. Magnification ×100, Scale bar 5 μm; potential applied, 1.4 V (vs. Ag/AgCl, 3 M KCl); acquisition time, 0.5 s. The TOF is the number of photons emitted in 1 s by a single Ru luminophore ( see also Results and “Supplementary Methods 1”). TOF@2.8 μm is the turnover frequency for 2.8 μm beads (Ru@2.8 μm). c Schematic representation of the tip generation–surface emission experiment where Ru@ITO is transparent indium tin oxide (ITO) electrode functionalized with a [Ru(bpy)3]2+ monolayer as the emitting surface and d ECL intensity as a function of the tip–surface distance for a small electrode (blue curve and dots) and a large electrode (green dots) and ECL intensity of the ref. 23 (red curve). ECL@2.8 μm is the ECL intensity for 2.8 μm distance between tip and surface. The inset in c shows the ECL intensity image profile acquired for a small and a large Pt hemispherical electrode at 1.4 V. Magnification ×4, scale bar, 500 μm. The potentials applied via cyclic voltammetry at a scan rate of 100 mV s−1 ranged from 0 to 1.4 V (vs. Ag/AgCl 3 M KCl). TPrA: tri-n-propylamine. Error bar shows the standard deviation (n = 10).

