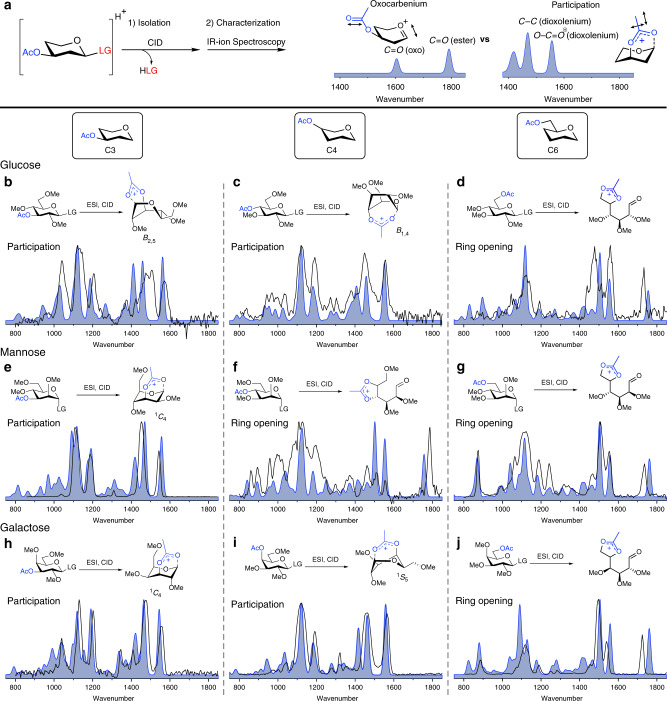
Fig. 3. Infrared ion spectroscopy of glycosyl cations.
a Oxocarbenium ions and dioxolenium ions give different diagnostic peaks (in blue). Overview of a comparison of the computed IR-ion spectra (filled blue) and the measured IR-ion spectra (black line) of the glycosyl cations derived from glucosyl (b–d), mannosyl (e–g) and galactosyl (h–j) donors 1–9. Ring-opening of donors 3, 5, 6, and 9 have been presented as accessible structures, their exact conformation is presented in Supplementary Figs. 3, 5, 6, and 9 and coordinates presented in the Supplementary Data file.

