Figure 5.

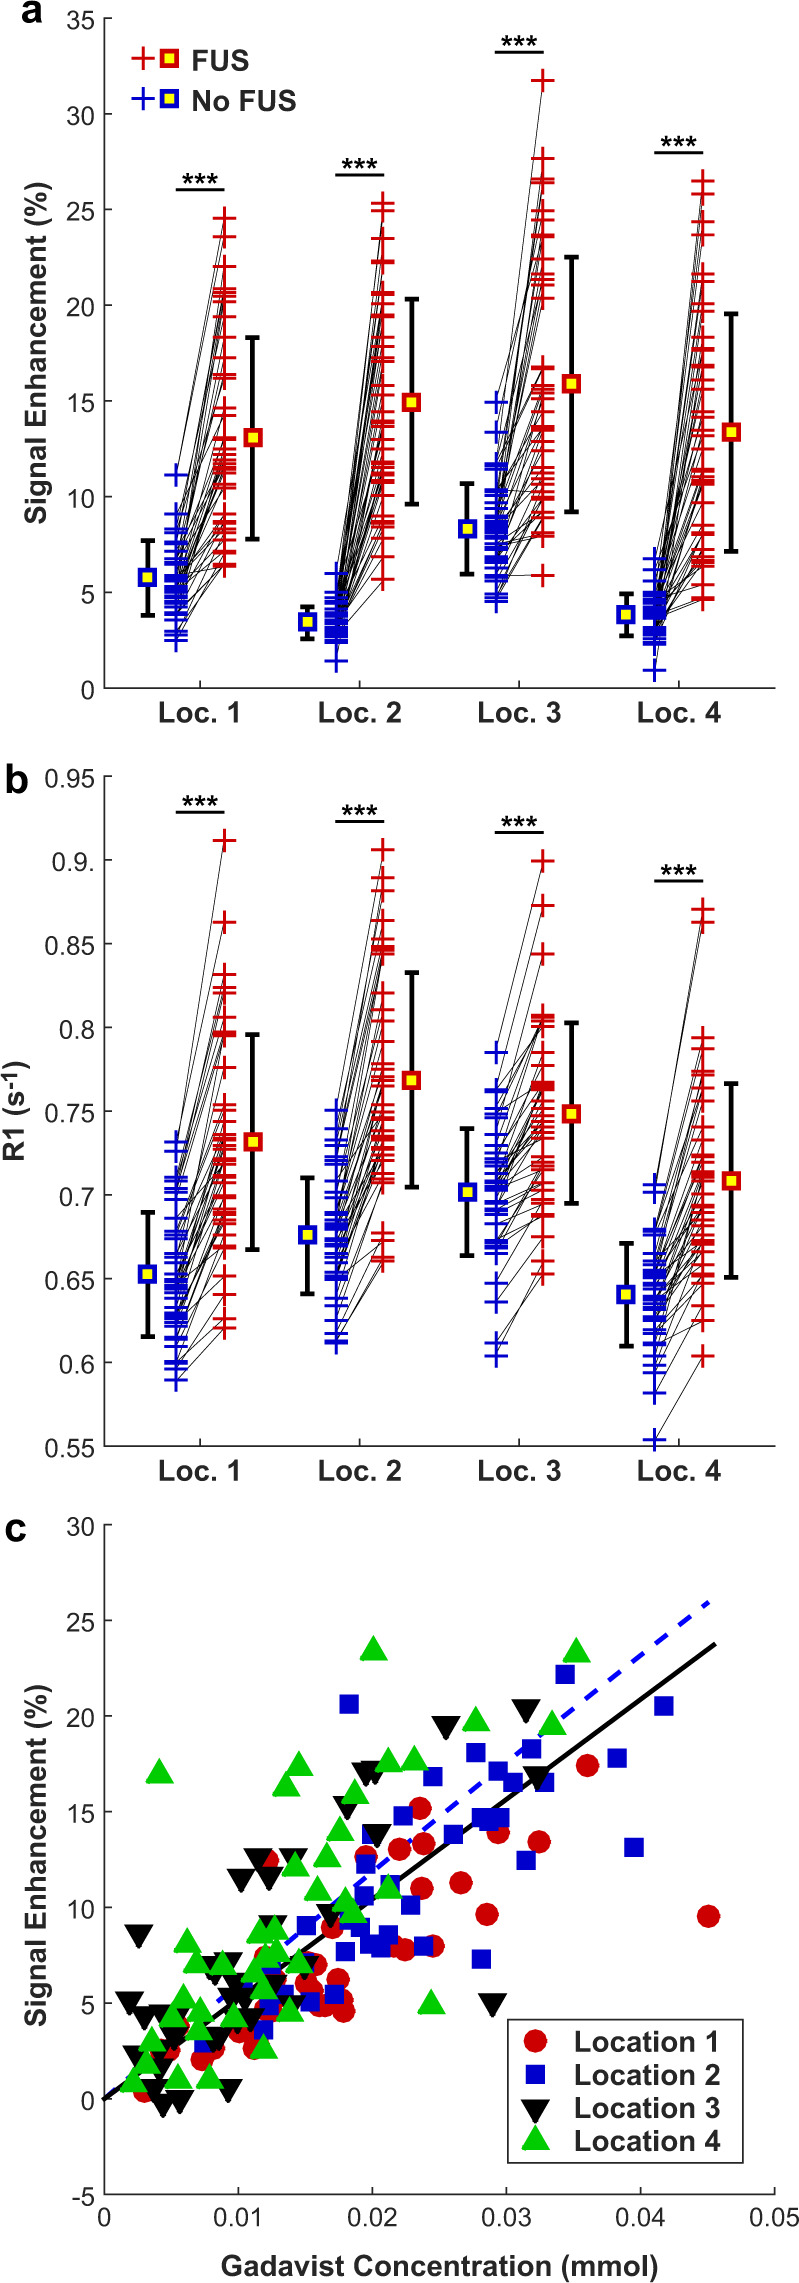
(a) Mean changes in MRI signal intensity in T1-weighted imaging after Gadavist injection for the four sonicated locations and the corresponding non-sonicated targets in the contralateral hemisphere for all rats and FUS sessions. The signal change was greater in the sonicated hemisphere in all but one of the sonicated locations. (b) Mean R1 relaxation time measured in these four locations. In every case, R1 was larger in the sonicated hemisphere. (c) Plot showing the change in signal enhancement in T1-weighted imaging as a function of the Gadavist concentration, which was estimated from the difference in R1 between the sonicated and non-sonicated hemispheres and the relaxivity of the contrast agent (4.44 s−1· mM−1). The solid line shows the results of a linear regression through zero (R2: 0.53). The dotted line shows the expected signal intensity change in this range of Gadavist concentrations, based on the equation for the signal intensity of a spin-echo sequence, the sequence parameters, and the R1 and R2 values of brain tissue. (***P < 0.001).
