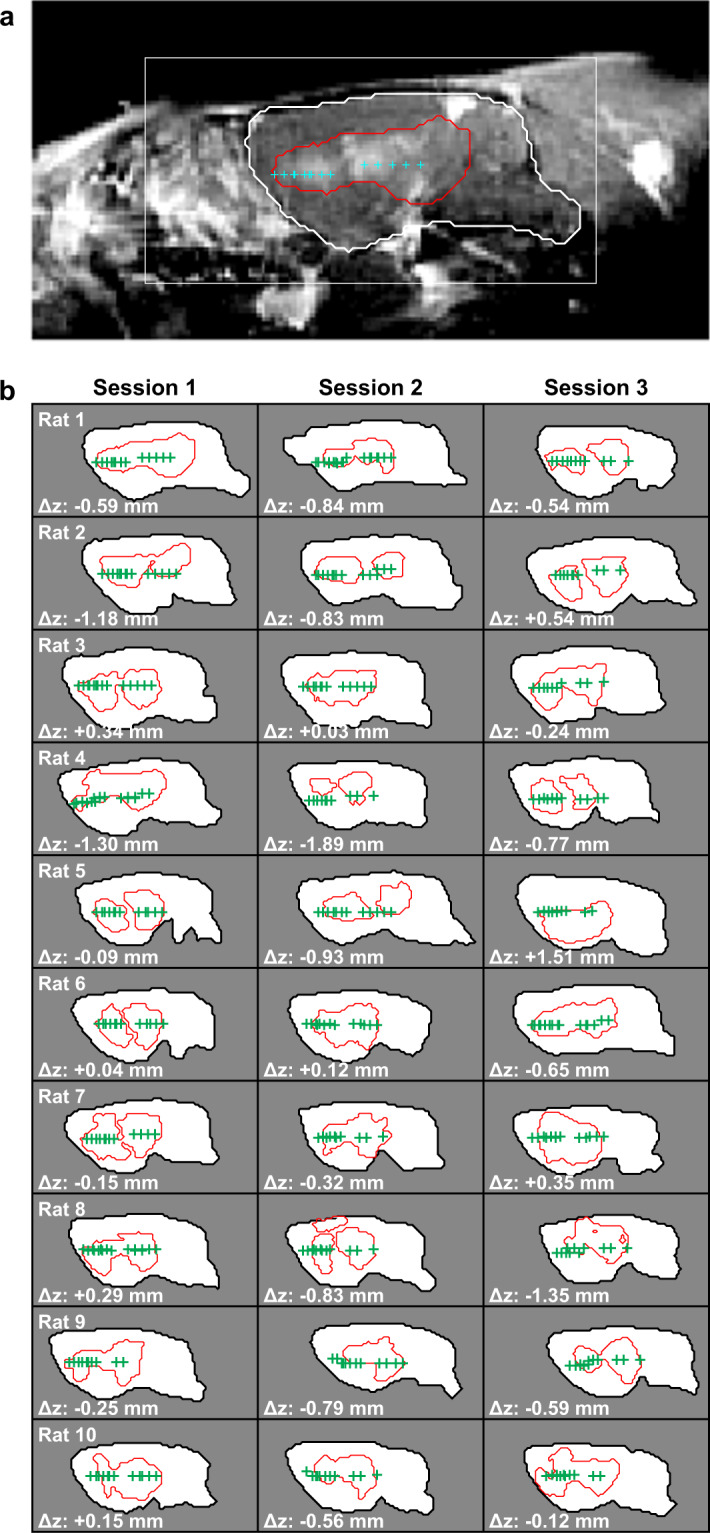
Figure 7.

(a) Sagittal contrast-enhanced T1-weighted MRI showing BBB disruption, evident in the area outlined in red. The targets that were within ±1 mm of this image plane are shown, and the brain is segmented with a white contour. (b) Segmentations of the brain and the area with evident BBB disruption for 30 consecutive sessions. The targets are indicated. In most cases, the extent of the BBB disruption was contained within the brain. In a few cases, the disruption reached the brain surface proximal to the transducer. The distance between the average depth of the segmented BBB disruption and the target plane was less than one millimeter in 25/30 sessions.
