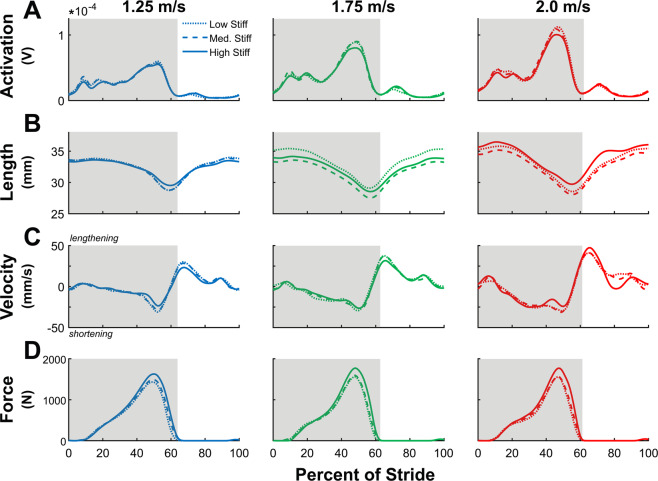
Figure 5.
Soleus muscle time-series data. Stride-normalized data of (A) Soleus activation (N = 14, left limb), (B) Soleus fascicle length (N = 15, right limb), (C) Soleus fascicle velocity, and (D) Soleus fascicle force across different walk speeds. Stance-phase data is highlighted in grey. Soleus fascicle shortening velocity decreased with added stiffness and increased with faster walk speeds, and fascicle force increased with both added stiffness and faster walking speeds. Soleus EMG activation increased with faster walk speeds, but did not change with added foot stiffness.

